Fig. 6.
Download original image
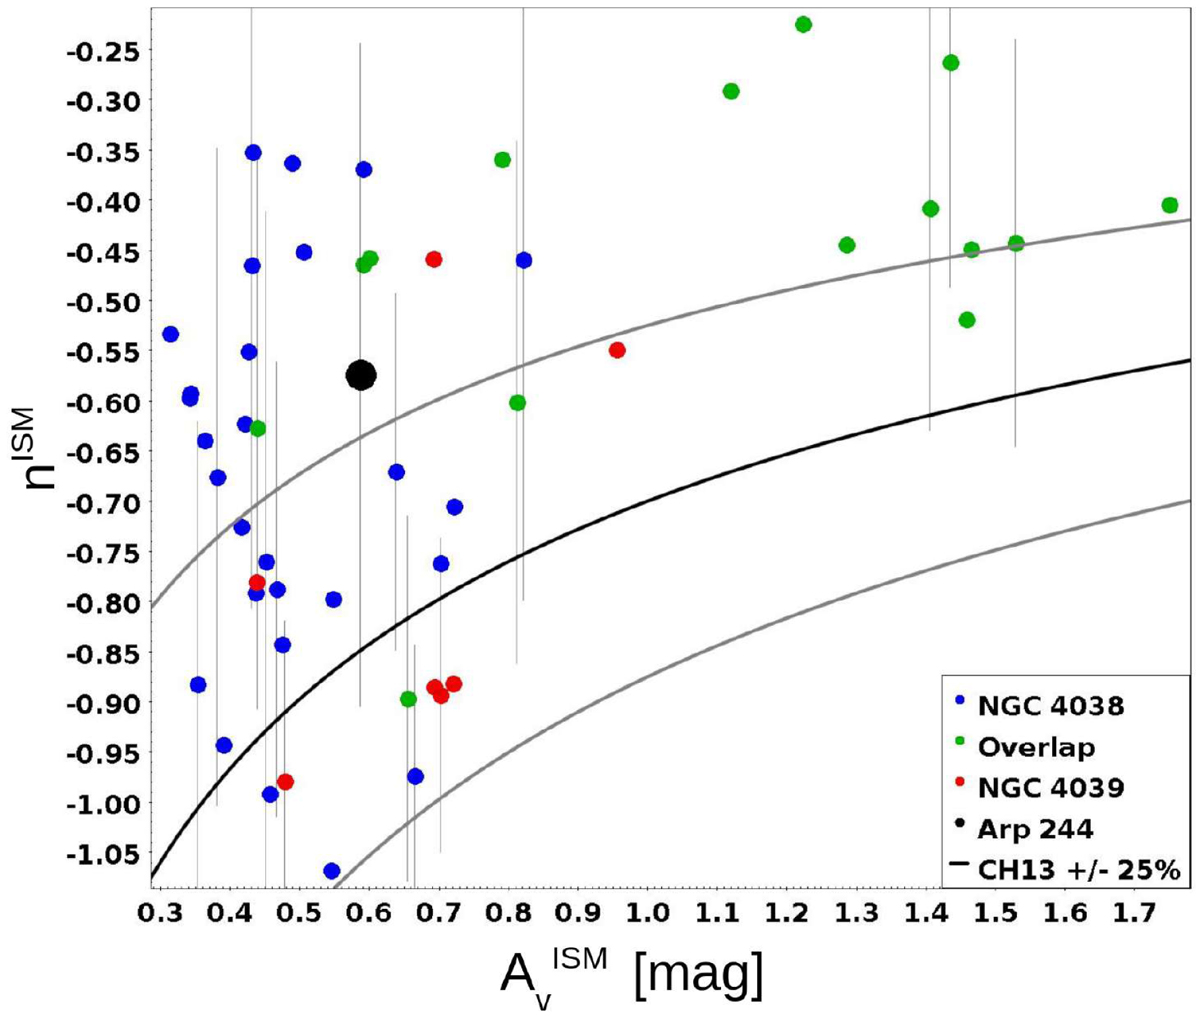
Slope of the attenuation curve nISM plotted against the optical dust attenuation of the ISM, ![]() . Blue, green, and red dots represent the 58 regions and the black dot the entire galaxy. Only one out of three error bars is plotted to maintain the readability of the plot. The black curve represents the best fit with their associated error (grey curves, defined as 25% by CH13).
. Blue, green, and red dots represent the 58 regions and the black dot the entire galaxy. Only one out of three error bars is plotted to maintain the readability of the plot. The black curve represents the best fit with their associated error (grey curves, defined as 25% by CH13).
Current usage metrics show cumulative count of Article Views (full-text article views including HTML views, PDF and ePub downloads, according to the available data) and Abstracts Views on Vision4Press platform.
Data correspond to usage on the plateform after 2015. The current usage metrics is available 48-96 hours after online publication and is updated daily on week days.
Initial download of the metrics may take a while.