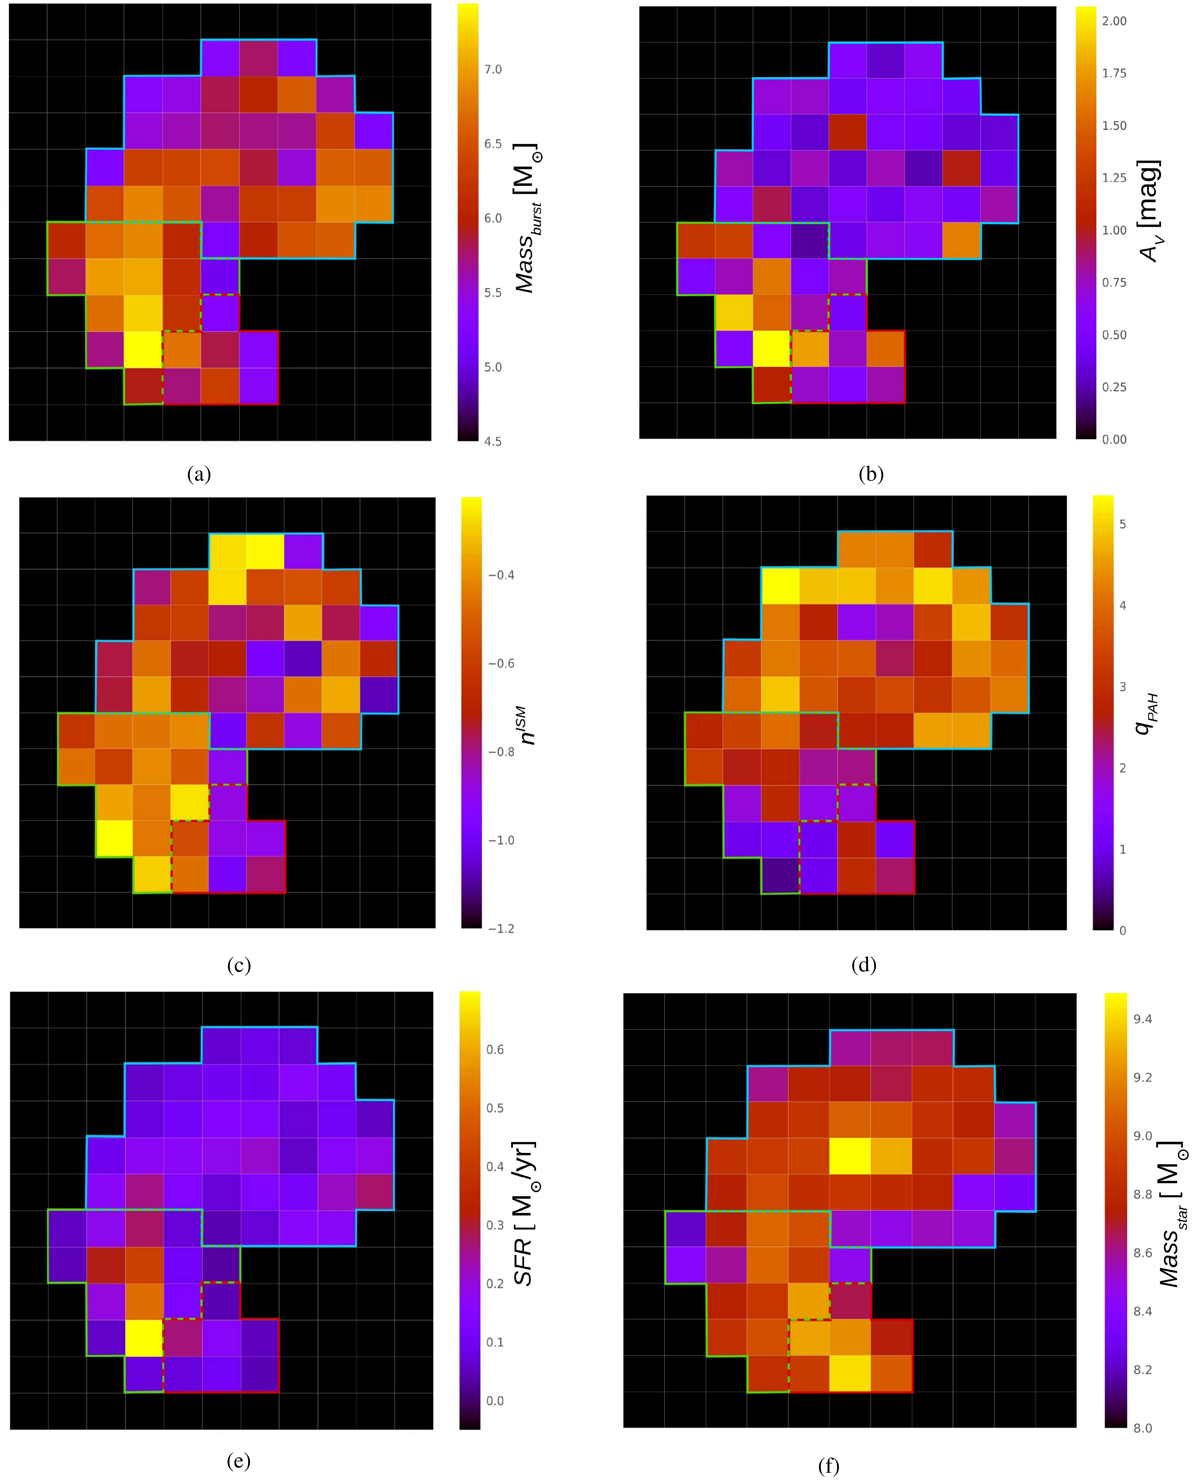
Fig. 5.
Download original image
Pixelated maps of the Antennae galaxies representing the spatial distribution of several parameters: (a) mass of the bursting population, (b) V-band attenuation, (c) slope of the attenuation curve, (d) qPAH distribution, (e) star formation rate, and (f) stellar mass. Coloured contours are over-plotted to separate the three components of the galaxies: blue for NGC 4038, red for NGC 4039, and green for the Overlap. Logarithmic masses have been mapped in panels (a) and (f) to allow for better visualisation.
Current usage metrics show cumulative count of Article Views (full-text article views including HTML views, PDF and ePub downloads, according to the available data) and Abstracts Views on Vision4Press platform.
Data correspond to usage on the plateform after 2015. The current usage metrics is available 48-96 hours after online publication and is updated daily on week days.
Initial download of the metrics may take a while.