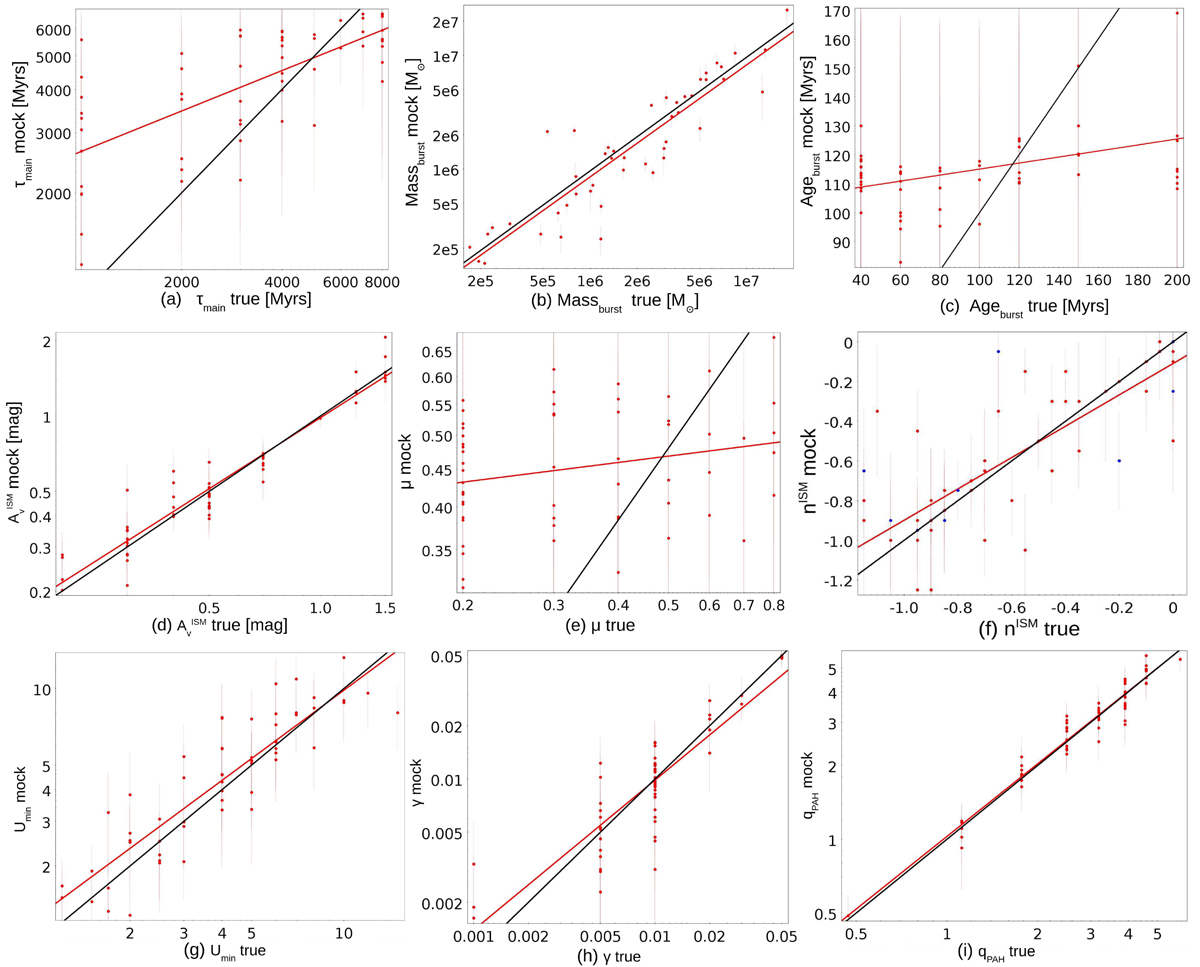
Fig. 4.
Download original image
Results of the mock analysis. The input parameters used to build the mock catalogue are shown on the x-axis while the results of the fitting of the mock catalogues are shown on the y-axis with their associated error bars. The black solid line indicates the one-to-one relationship. The red solid line represents the linear fit of our points. The blue dots in panel f are the regions with ![]() < 0.3 mag.
< 0.3 mag.
Current usage metrics show cumulative count of Article Views (full-text article views including HTML views, PDF and ePub downloads, according to the available data) and Abstracts Views on Vision4Press platform.
Data correspond to usage on the plateform after 2015. The current usage metrics is available 48-96 hours after online publication and is updated daily on week days.
Initial download of the metrics may take a while.