Fig. 2
Download original image
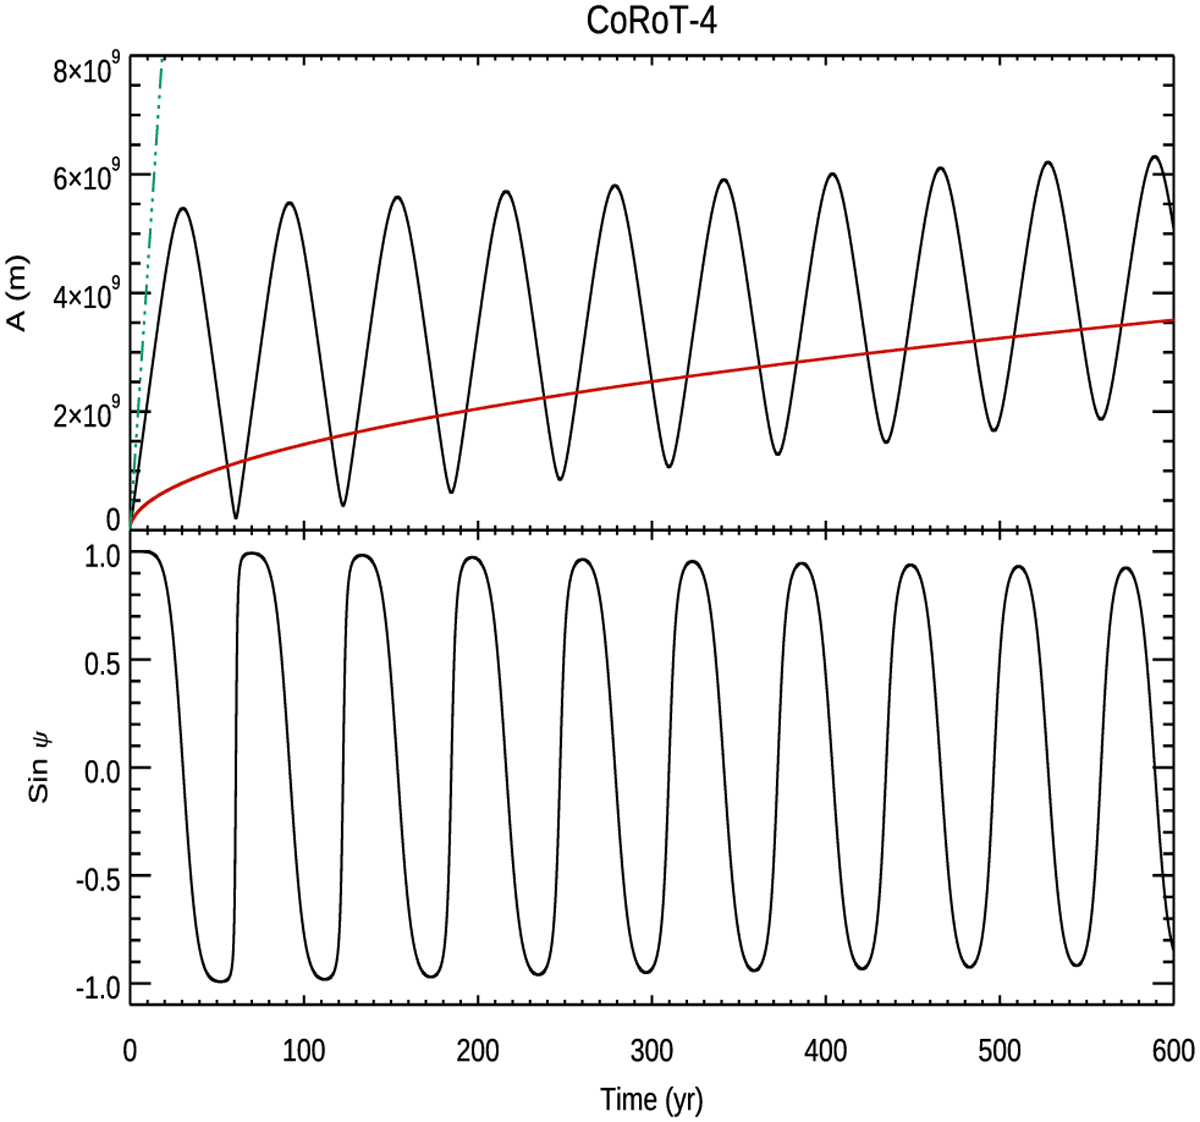
Auto-resonance in CoRoT-4. Top panel: amplitude of the azimuthal oscillations of the resonant flux tube vs. the time (solid black line). The amplitude of the asymptotic solution (44) is plotted as a solid red line for A0 = 0, and the amplitude in the case of a perfect and continuous phase locking (sin ψ = 1, constant) is plotted as a three-dot-dashed green line. Lower panel: sine of the phase lag angle ψ vs. the time in CoRoT-4.
Current usage metrics show cumulative count of Article Views (full-text article views including HTML views, PDF and ePub downloads, according to the available data) and Abstracts Views on Vision4Press platform.
Data correspond to usage on the plateform after 2015. The current usage metrics is available 48-96 hours after online publication and is updated daily on week days.
Initial download of the metrics may take a while.