Open Access
Fig. 1
Download original image
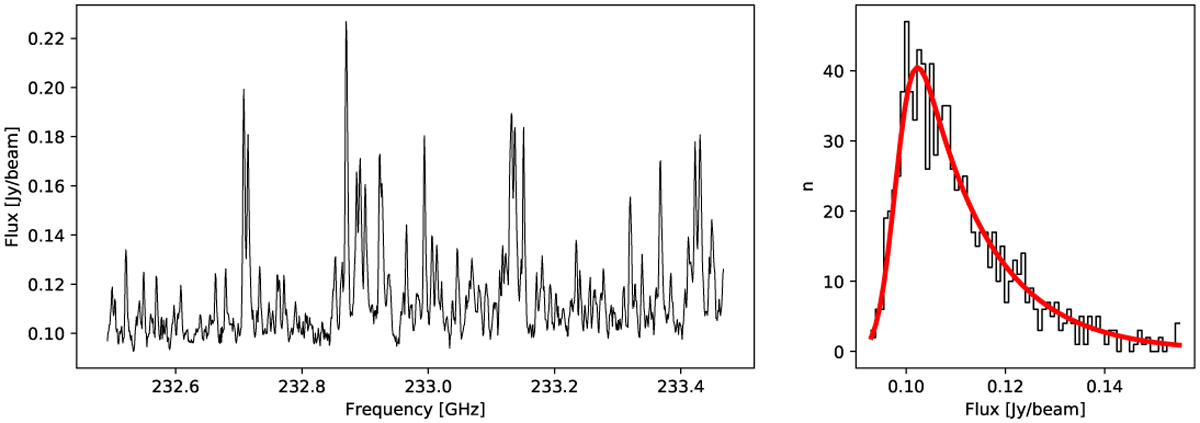
Left: spectrum with molecular line emission in the Band 6 spw7 band. Right: distribution of the intensity channels (in black). An exponentially modified Gaussian (in red) is adjusted to fit the Gaussian part due to the noise, whose peak is taken as the continuum value, and the tail associated with the molecular emission.
Current usage metrics show cumulative count of Article Views (full-text article views including HTML views, PDF and ePub downloads, according to the available data) and Abstracts Views on Vision4Press platform.
Data correspond to usage on the plateform after 2015. The current usage metrics is available 48-96 hours after online publication and is updated daily on week days.
Initial download of the metrics may take a while.