Fig. 8
Download original image
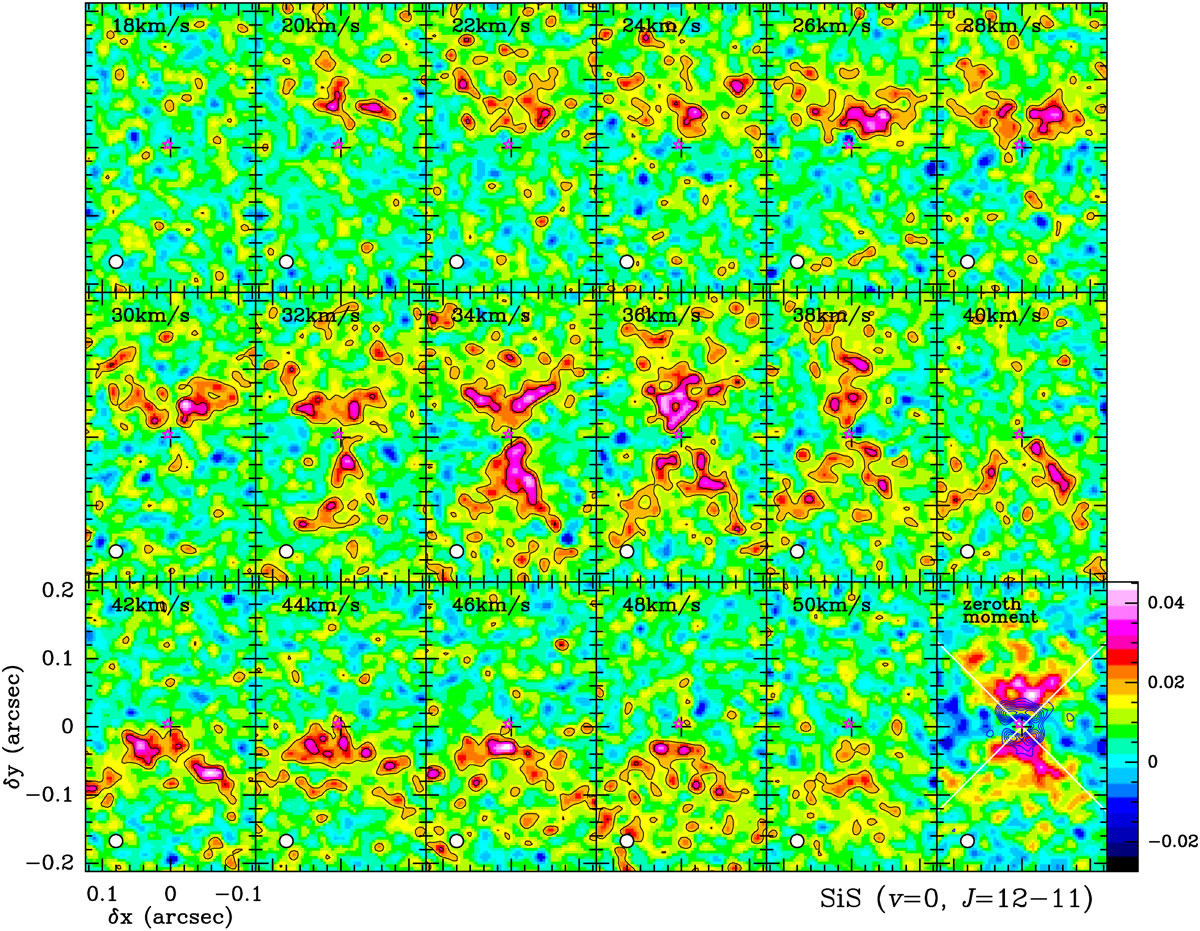
SiS υ = 0, J = 12–11 velocity-channel maps with a beam with HPBW=20 mas × 20 mas; note the smaller field of view compared with that of the 60 mas-resolution maps show in Fig. 7. Contours are 2σ, 4σ, … by 4σ (σ = 0.5 mJy beam−1). In the last panel, the zeroth moment map of SiS (integrated over VLSR = [18:52] km s−1) is shown (color scale and wedge) together with that of the NaCl line-stacked data (contours). Units of the wedge are Jy beam−1 km s−1. Two orthogonal segments are used to outline the opening angle of the SS-outflow at its base (~90°).
Current usage metrics show cumulative count of Article Views (full-text article views including HTML views, PDF and ePub downloads, according to the available data) and Abstracts Views on Vision4Press platform.
Data correspond to usage on the plateform after 2015. The current usage metrics is available 48-96 hours after online publication and is updated daily on week days.
Initial download of the metrics may take a while.