Fig. 5
Download original image
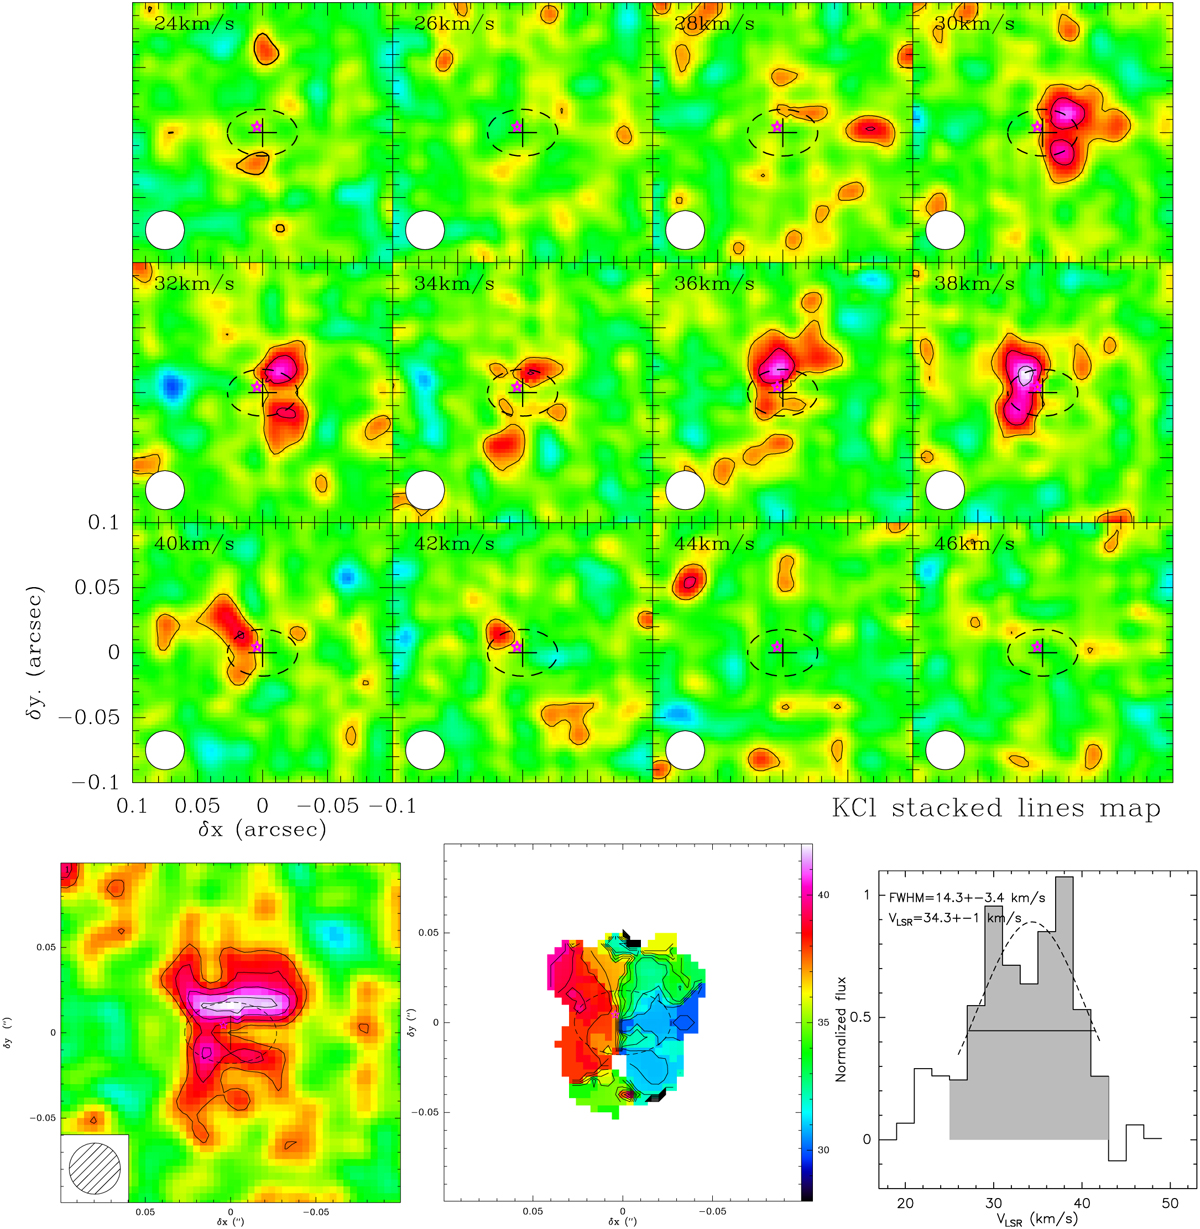
ALMA data of KCl after stacking together the individual KCl transitions detected in this work from Table 2 and Fig. A.4. Top: velocity channel maps rotated by 25° clockwise so the symmetry axis of the disk is vertical; contours are 1σ, 2σ,… by 1σ (σ = 0.5 mJy beam−1). In this case, maps were restored using natural weight and a clean beam with HPBW = 0″.03 × 0″.03, plotted at the bottom-left corner of each panel. The center of the dust disk (dashed ellipse) inferred from the continuum emission maps is marked with a cross (RA = 07h42m 16.91500 and Dec= −14°42′50″.0716, J20000) and has been adopted as the origin of positional offsets in these and all subsequent figures illustrating image data. The position of the central mass-losing star QX Pup, slightly offset from the map (or disk) center, is marked with a star-like symbol. Bottom-left: zeroth moment map over the VLSR = [24:46] km s−1 velocity range; contours are 2σ, 3σ … by 1σ (σ = 2.1 mJy beam−1). Bottom-center: first moment map; contours going from VLSR = 26 to 44 by 1 km s−1. The wedge indicates the color-VLSR relationship. Bottom-right: integrated 1d-spectrum normalized to the peak of the stacked line. A Gaussian fit to the line profile (dashed line) is shown together with the values derived for the line centroid and full width at half maximum.
Current usage metrics show cumulative count of Article Views (full-text article views including HTML views, PDF and ePub downloads, according to the available data) and Abstracts Views on Vision4Press platform.
Data correspond to usage on the plateform after 2015. The current usage metrics is available 48-96 hours after online publication and is updated daily on week days.
Initial download of the metrics may take a while.