Fig. 2
Download original image
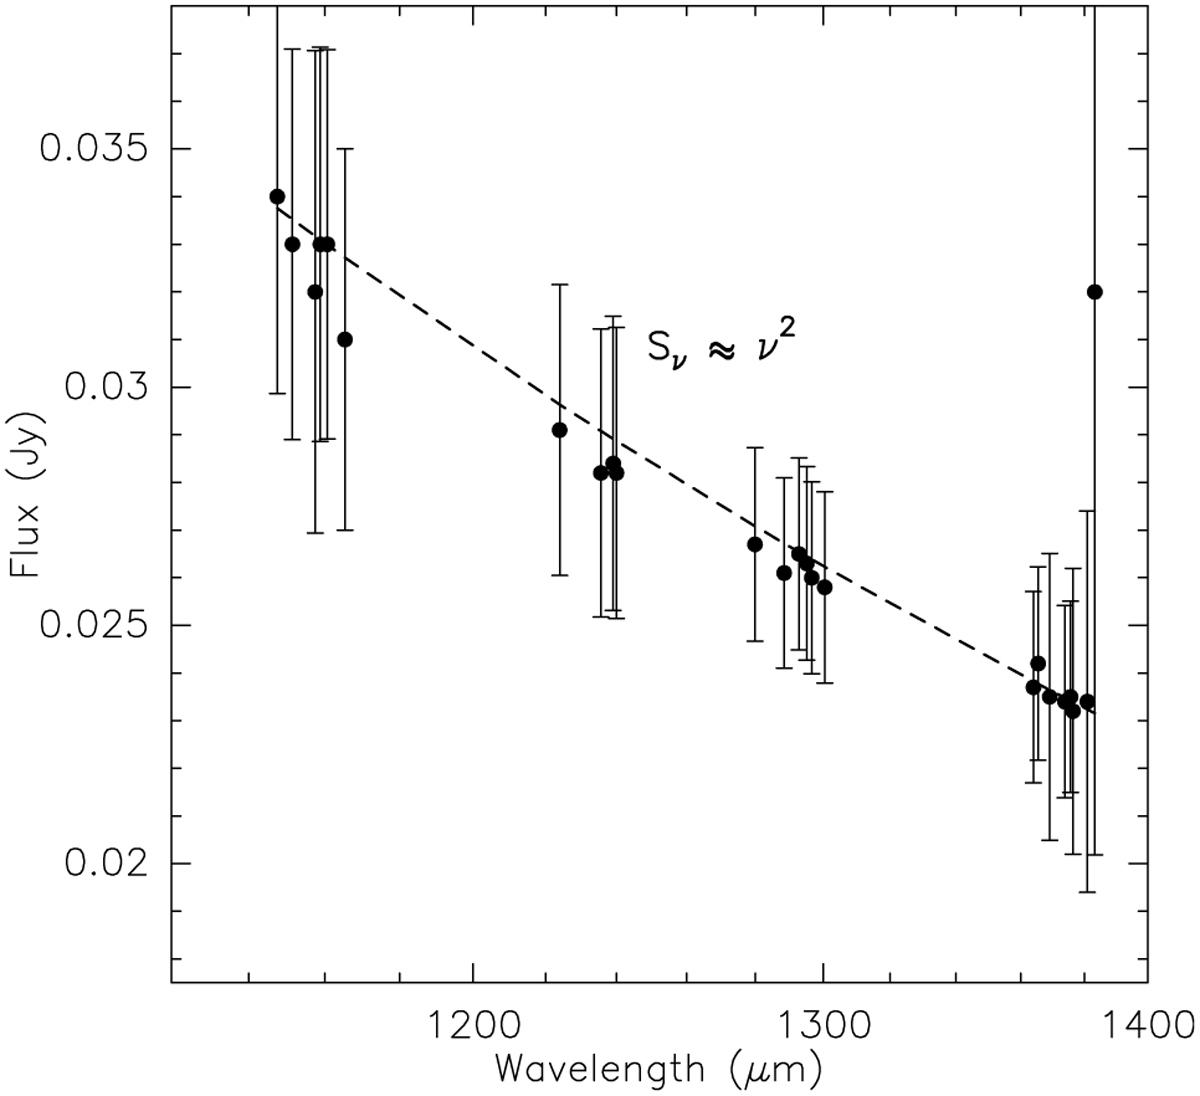
Spectral energy distribution (SED) of OH 231.8 showing the continuum emission flux measurements from the individual SPWs observed in this project (Table 1). The dashed line represents the best-fit power law of the continuum flux. The outlier at 216.7 GHz (nearest to 1400 μm) has very large errorbars possibly reflecting a calibration problem or some contamination by H2S line emission.
Current usage metrics show cumulative count of Article Views (full-text article views including HTML views, PDF and ePub downloads, according to the available data) and Abstracts Views on Vision4Press platform.
Data correspond to usage on the plateform after 2015. The current usage metrics is available 48-96 hours after online publication and is updated daily on week days.
Initial download of the metrics may take a while.