Fig. A.3
Download original image
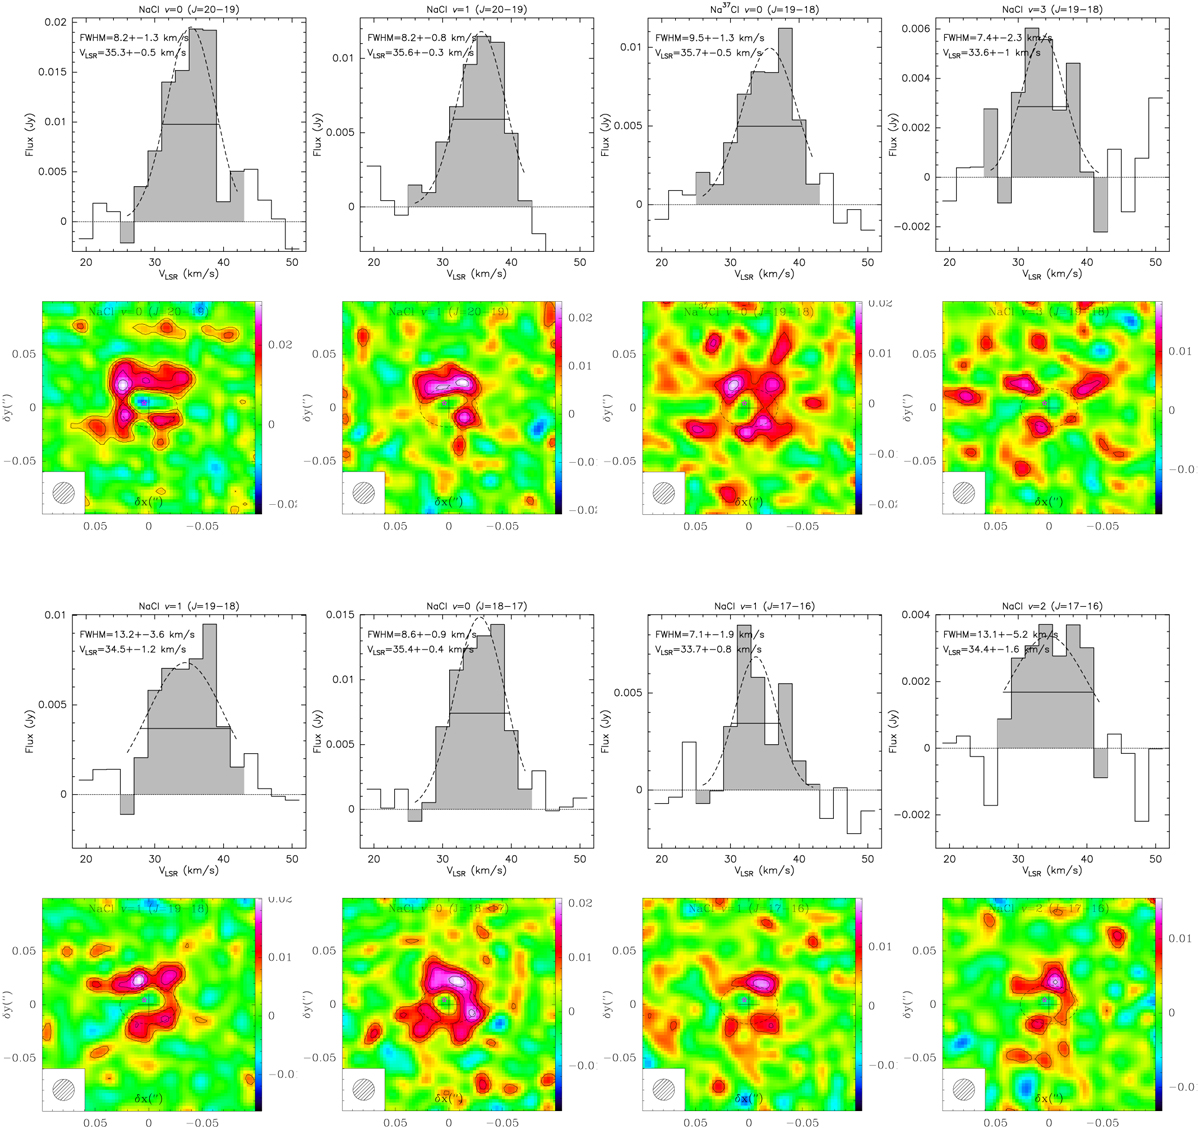
Total emission spectra and integrated intensity maps of the eigth NaCl transitions detected in this work (lable 2). Robust weigthing has been used to restore the emission maps with a half-power clean beam width of HPBW=0″.02×0″.02. Contours are 2σ, 3σ, 4σ, … with σ=4.6, 4.3, 4.4, 3.9, 3.5, 3.8, 3.7, and 2.9 mJy beam−1, for the maps from left to right and top to bottom. Maps are rotated by 25° clockwise so the symmetry axis of the nebula is vertical.
Current usage metrics show cumulative count of Article Views (full-text article views including HTML views, PDF and ePub downloads, according to the available data) and Abstracts Views on Vision4Press platform.
Data correspond to usage on the plateform after 2015. The current usage metrics is available 48-96 hours after online publication and is updated daily on week days.
Initial download of the metrics may take a while.