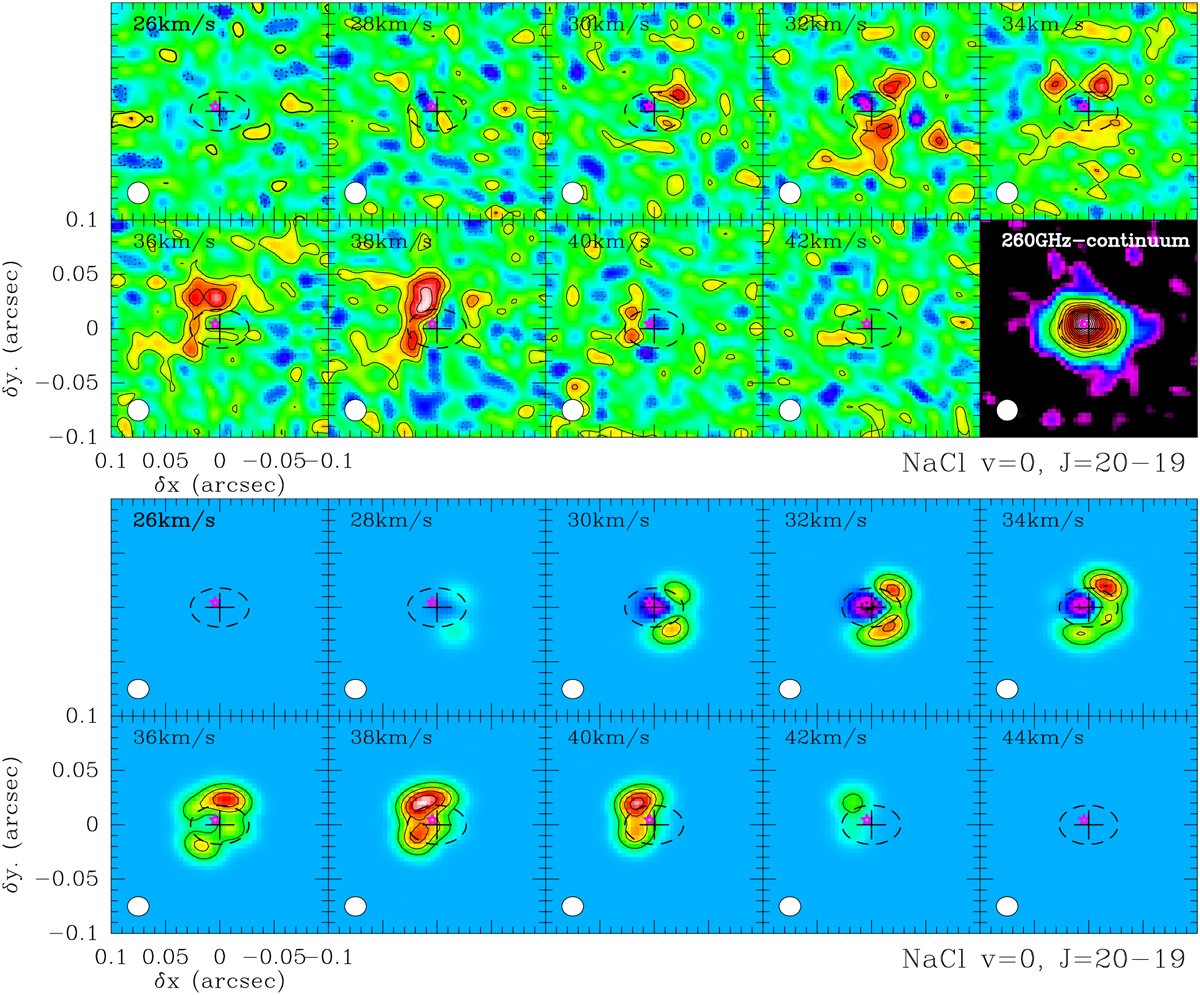
Fig. A.2
Download original image
Comparisson between observed and synthetic NaCl velocity-channel maps.Top: ALMA velocity-channel maps of the NaCl(υ = 0, J = 20–19) transition; in the last panel, we show the continuum ALMA maps obtained using the line-free channels of the spectral window that covers that transition. All maps are rotated by 25° clockwise so the symmetry axis of the disk is vertical. Contours in the line and continuum maps are spaced every 1.1 mJy/beam, equivalent to 50 K in main-beam temperature units. The clean beam (HPBW=0″.02 × 0″.02) is plotted at the bottom-left corner of each panel. The dashed ellipse represents the dust disk model deduced from the analysis of the continuum maps presented in § 3.1 and Fig. 1. The position of QXPup, coincident with the continuum emission peak, is indicated by the purple star-like symbol. Bottom: Synthetic NaCl (υ = 0, J = 20–19) velocity-channel maps from our model (§ 5.2), represented as in the top panel.
Current usage metrics show cumulative count of Article Views (full-text article views including HTML views, PDF and ePub downloads, according to the available data) and Abstracts Views on Vision4Press platform.
Data correspond to usage on the plateform after 2015. The current usage metrics is available 48-96 hours after online publication and is updated daily on week days.
Initial download of the metrics may take a while.