Fig. A.1
Download original image
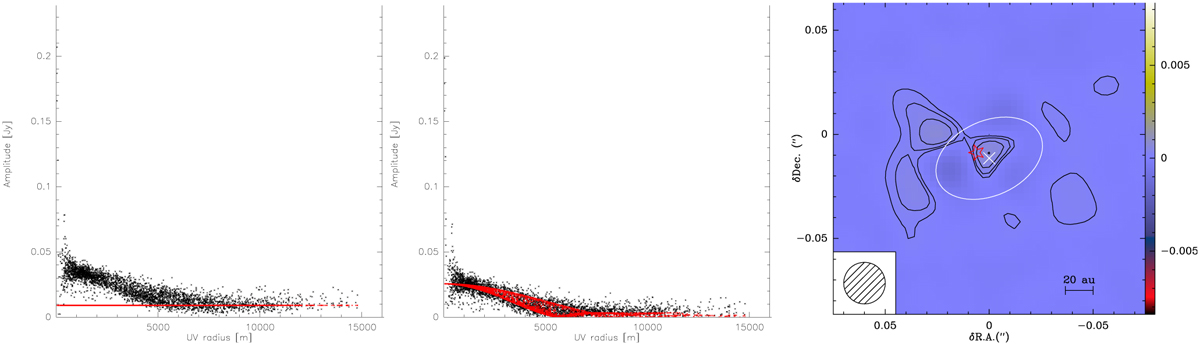
Dust continuum emission components. Left: Visibity amplitude (Jy) vs. the antenna spacing in the uv plane (m) of the continuum emission at 261.3 GHz (self-calibrated data) in black and model fit of a point source (flux= 9.1 ±0.1 mJy) in red. Middle: Residuals of the continuum visibility amplitude after subtraction of the point source model in the top panel in black and new model fit of the residuals adopting a uniform elliptical disc model (flux= 25.6±0.2mJy) in red. See details of the model fit parameters of both (point and elliptical disc) components in Sect. 3. In both panels, the uv-data are averaged over a time interval of 4500 s (approximately the total on-source integration time in each observing block) to reduce the noise in these plots. Right: Cleaned map of the residual after subtracting the point source and extended disk model to the observed 261 GHz-continuum map shown in Fig. 1 (left), using the same contour level step.
Current usage metrics show cumulative count of Article Views (full-text article views including HTML views, PDF and ePub downloads, according to the available data) and Abstracts Views on Vision4Press platform.
Data correspond to usage on the plateform after 2015. The current usage metrics is available 48-96 hours after online publication and is updated daily on week days.
Initial download of the metrics may take a while.