Fig. 13
Download original image
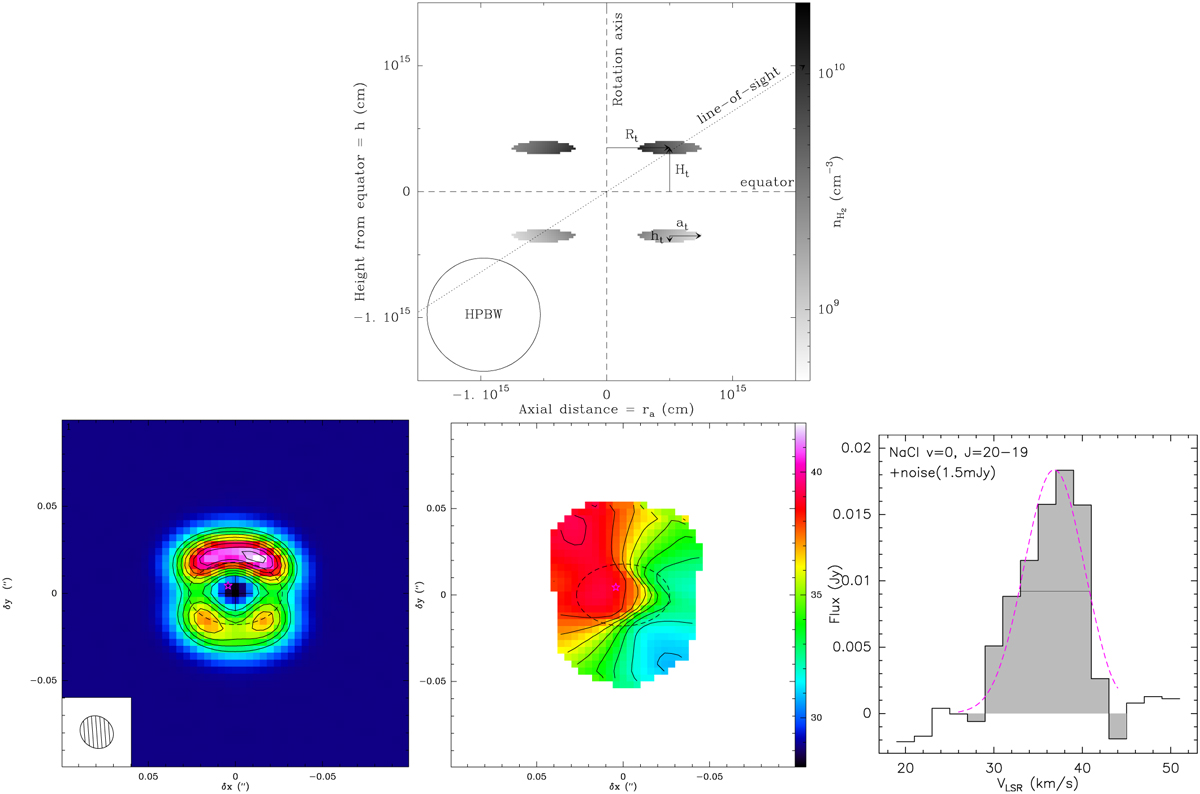
Model of the NaCl rotating disk. Top: schematic representation of the geometry and density distribution of the NaCl-emitting region adopted in our model (Sect. 5.2 and Table 3). The plot is a cut of this region by a plane that contains both the line of sight and the rotation axis of the nebula. The latter is oriented in the sky along PA ~ 25°. The linear size of the 20 mas beam (at d = 1500 pc) of our ALMA NaCl maps is shown in the lower-left corner. Bottom: synthetic NaCl ALMA data from our LTE model plotted as in the bottom panels of Fig. 3. The synthetic cubes of the NaCl (υ = 0, J = 20–19) transition are shown in Fig. A.2.
Current usage metrics show cumulative count of Article Views (full-text article views including HTML views, PDF and ePub downloads, according to the available data) and Abstracts Views on Vision4Press platform.
Data correspond to usage on the plateform after 2015. The current usage metrics is available 48-96 hours after online publication and is updated daily on week days.
Initial download of the metrics may take a while.