Fig. 12

Download original image
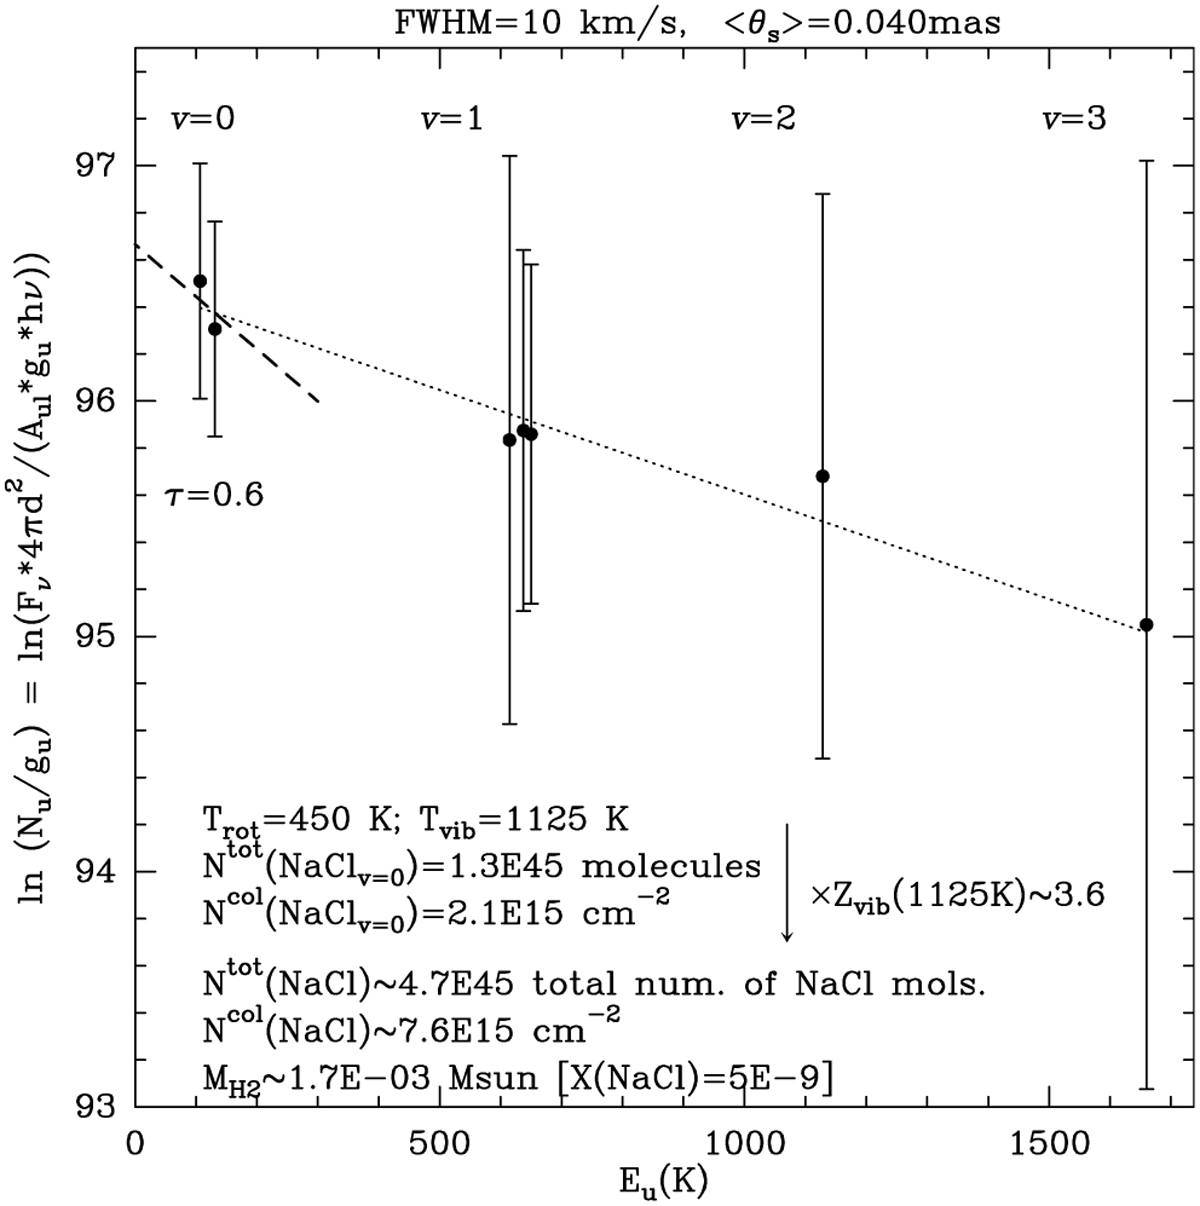
Population diagram of NaCl. A linear fit to the data using all the NaCl transitions detected across all vibrational levels from υ = 0 to υ = 3 indicates a vibrational temperature of Tvib ~ 1125 K (dotted line). The slope of the dashed line, consistent with the observed ln(Nu/gu) vs. Eu values for the only two NaCl υ = 0 transitions observed, corresponds to Trot ~ 450 K. The values for the total number of NaCl molecules and column density in the ground vibrational level are indicated, as well as the corresponding values after multiplying the former by the vibrational partition function to account for the NaCl distribution across multiple vibrational levels.
Current usage metrics show cumulative count of Article Views (full-text article views including HTML views, PDF and ePub downloads, according to the available data) and Abstracts Views on Vision4Press platform.
Data correspond to usage on the plateform after 2015. The current usage metrics is available 48-96 hours after online publication and is updated daily on week days.
Initial download of the metrics may take a while.


