Fig. 11
Download original image
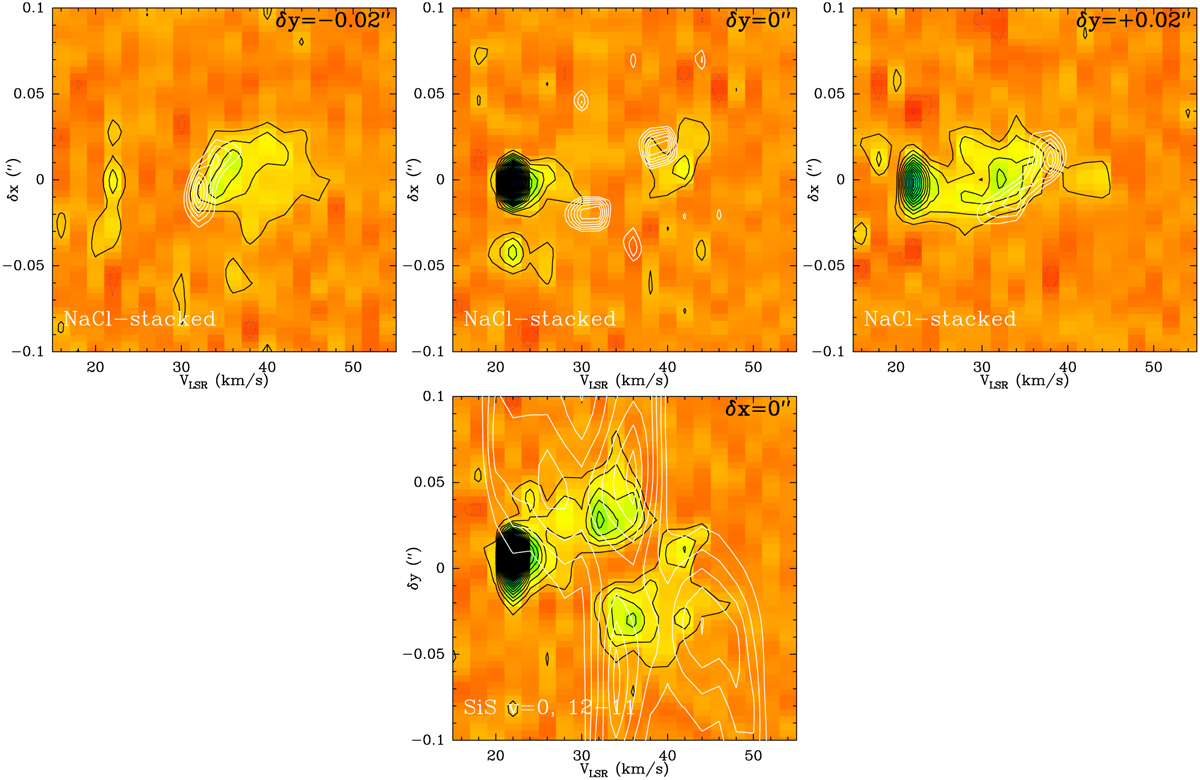
Position velocity (PV) cuts of SiO υ = 1, J = 6–5 along the direction of the equator (PA = 115°) through different δy offsets (δy = −0″.02, 0″, and +0″.02 shown in the top panels) and the nebula axis (PA = 25°) through the nebula center (δx = 0″ − bottom) as in Fig. 4; NaCl line-stacked PV diagrams along the equator are overplotted (white contours) in the top panels. In the bottom panel, we overplot the SiS υ = 0, J = 12–11 axial PV-diagram instead to help visualizing the locus of the SiO υ = 1, J = 6–5 emission at the base of the SS-outflow arising from the lobes’ interior as well as the comparable expansive kinematics of these two transitions.
Current usage metrics show cumulative count of Article Views (full-text article views including HTML views, PDF and ePub downloads, according to the available data) and Abstracts Views on Vision4Press platform.
Data correspond to usage on the plateform after 2015. The current usage metrics is available 48-96 hours after online publication and is updated daily on week days.
Initial download of the metrics may take a while.