Fig. 10
Download original image
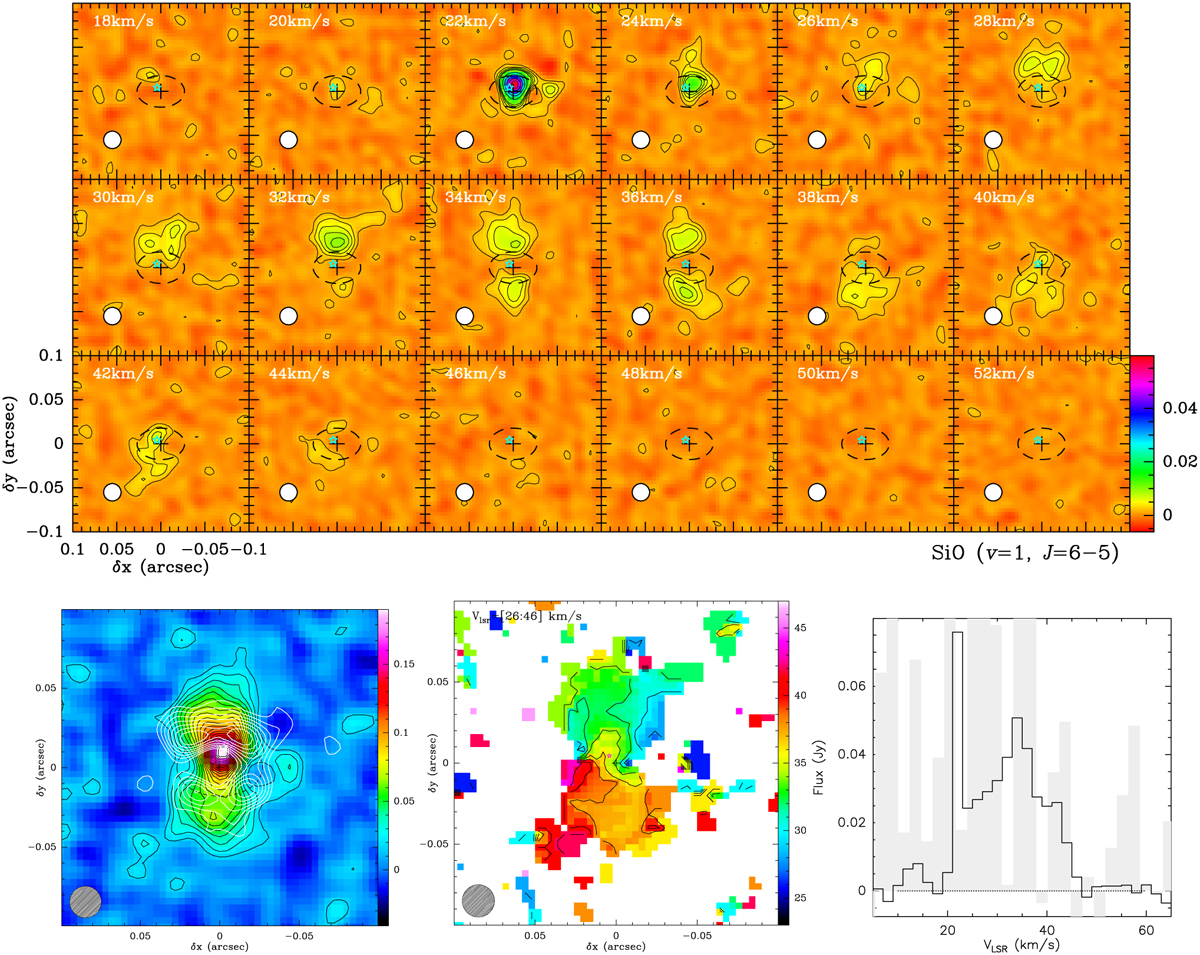
SiO υ = 1, J = 6–5 ALMA data. Top: velocity-channel maps; contours are: 2σ, 4σ to 10σ by 2σ and from 20σ to 60σ by 10σ (σ = 0.9 mJy beam−1 ). Bottom-left: integrated intensity (zeroth moment) map over the velocity range VLSR = [18:46] km s−1 ; contours are 2σ, 3σ,… by 1σ (σ = 8 mJy km s−1 beam−1). The NaCl line-stacked integrated intensity map is on top (white contours) for comparison. Bottom-center: velocity (first moment) map over the VLSR = [26:46] km s−1 range, i.e.,excluding channels VLSR ≤ 24 km s−1 (with amplified emission) for clarity. Bottom-right: ALMA integrated 1d-spectrum over the emitting area (black solid line) compared with the IRAM-30 m single-dish spectrum at this frequency where the SiO υ = 1, J = 6–5 line is undetected (light grey).
Current usage metrics show cumulative count of Article Views (full-text article views including HTML views, PDF and ePub downloads, according to the available data) and Abstracts Views on Vision4Press platform.
Data correspond to usage on the plateform after 2015. The current usage metrics is available 48-96 hours after online publication and is updated daily on week days.
Initial download of the metrics may take a while.