Fig. 1
Download original image
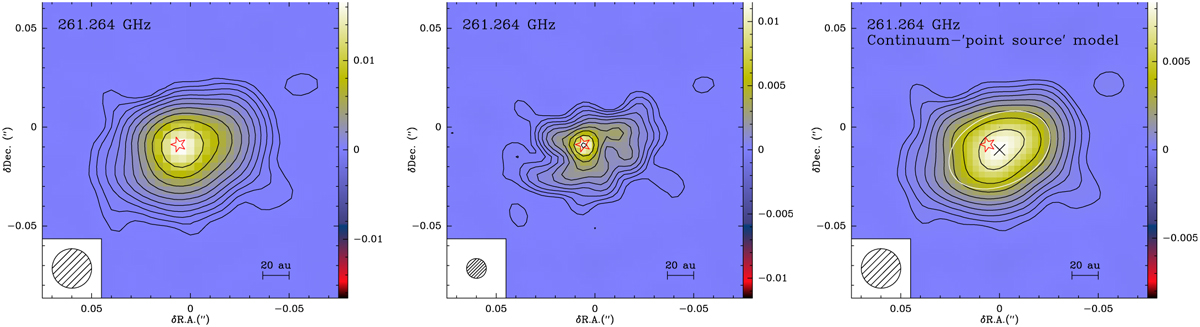
ALMA continuum emission maps at 261.264 GHz. Left and middle: continuum maps with 20 and 10 mas restoring beams, respectively (Sect. 2). Right: continuum map with 20 mas restoring beam after fitting and subtracting a point source model that is located at the position marked by the star-like symbol (see Sect. 3). The white ellipse represents the size and orientation of the extended disk model that best fits the emission in this map. We note the offset between the position of the point-like continuum source (star-like symbol at J2000, RA = 07h42m 16.91543 Dec = −14°42′50″.0691) and the center of the disk (cross at J2000, RA = 07h42m16s.91500 and Dec = -14°42′50″.0716). In all three panels, the level contours are 10(−3.77+(i−1)*0.2) Jy beam−1, i = 1 to 11 by 1 and the shaded circular areas at the bottom-left corner of the maps represent the half-power-beam-width (HPBW).
Current usage metrics show cumulative count of Article Views (full-text article views including HTML views, PDF and ePub downloads, according to the available data) and Abstracts Views on Vision4Press platform.
Data correspond to usage on the plateform after 2015. The current usage metrics is available 48-96 hours after online publication and is updated daily on week days.
Initial download of the metrics may take a while.