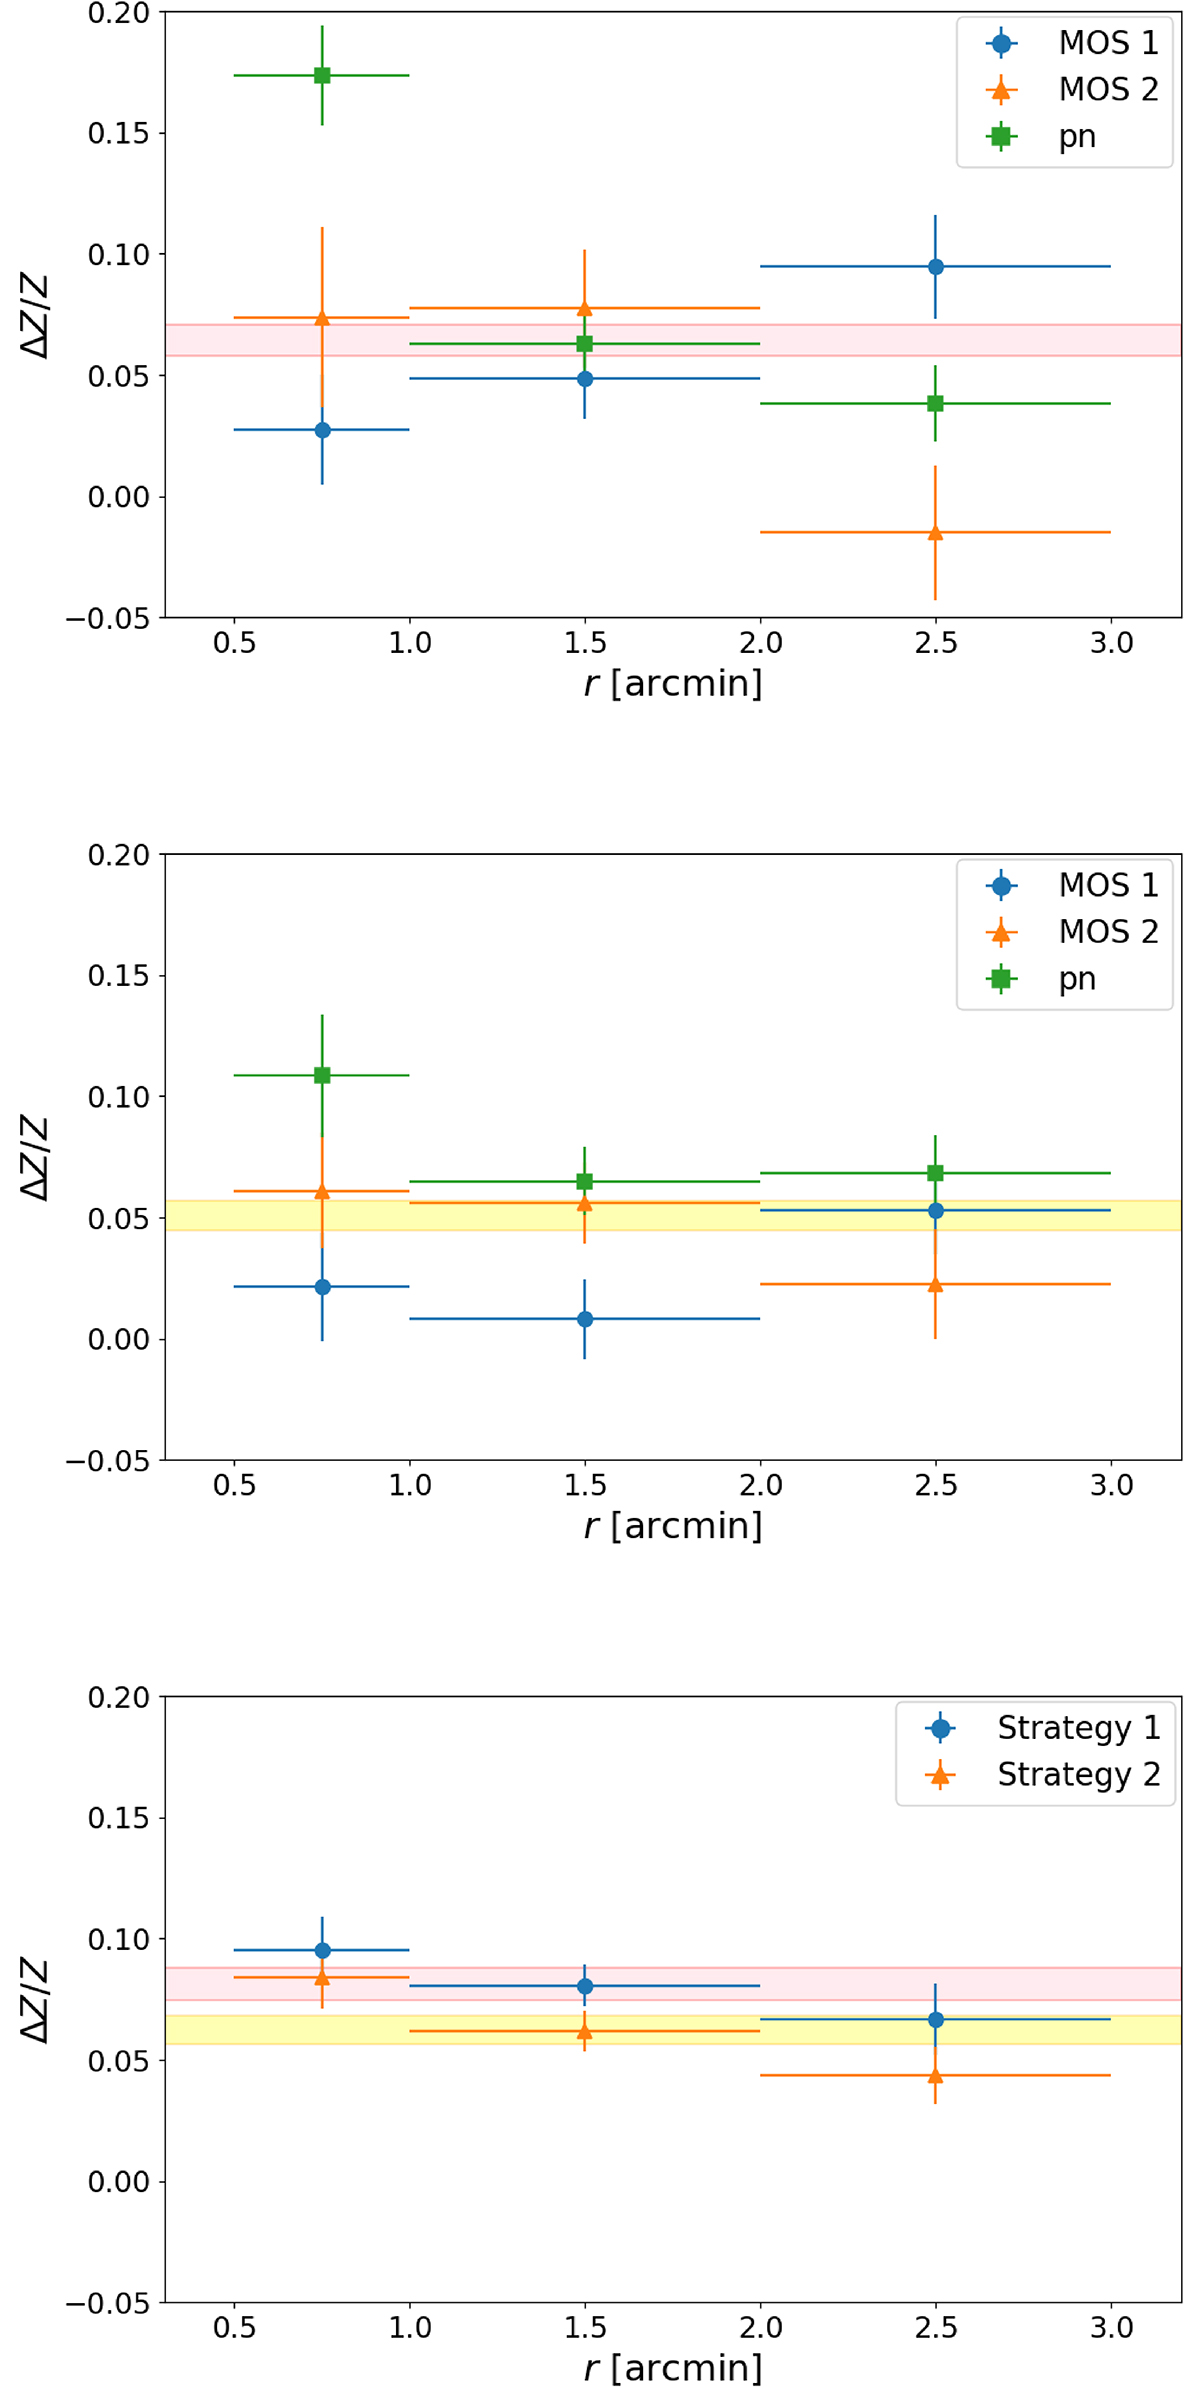
Fig. B.1.
Download original image
Radial profile of the systematic error ΔZ/Z for Perseus. In the top and centre panels the results obtained through an individual fit of the MOS and pn spectra of each region are shown, following strategy 1 and 2, respectively. In the bottom panel the same profiles are shown for the MOS and pn spectra that are considered jointly in the fitting. The weighted averages of the results are shown, together with their 1σ errors, as the pink and the yellow regions, for strategy 1 and 2, respectively.
Current usage metrics show cumulative count of Article Views (full-text article views including HTML views, PDF and ePub downloads, according to the available data) and Abstracts Views on Vision4Press platform.
Data correspond to usage on the plateform after 2015. The current usage metrics is available 48-96 hours after online publication and is updated daily on week days.
Initial download of the metrics may take a while.