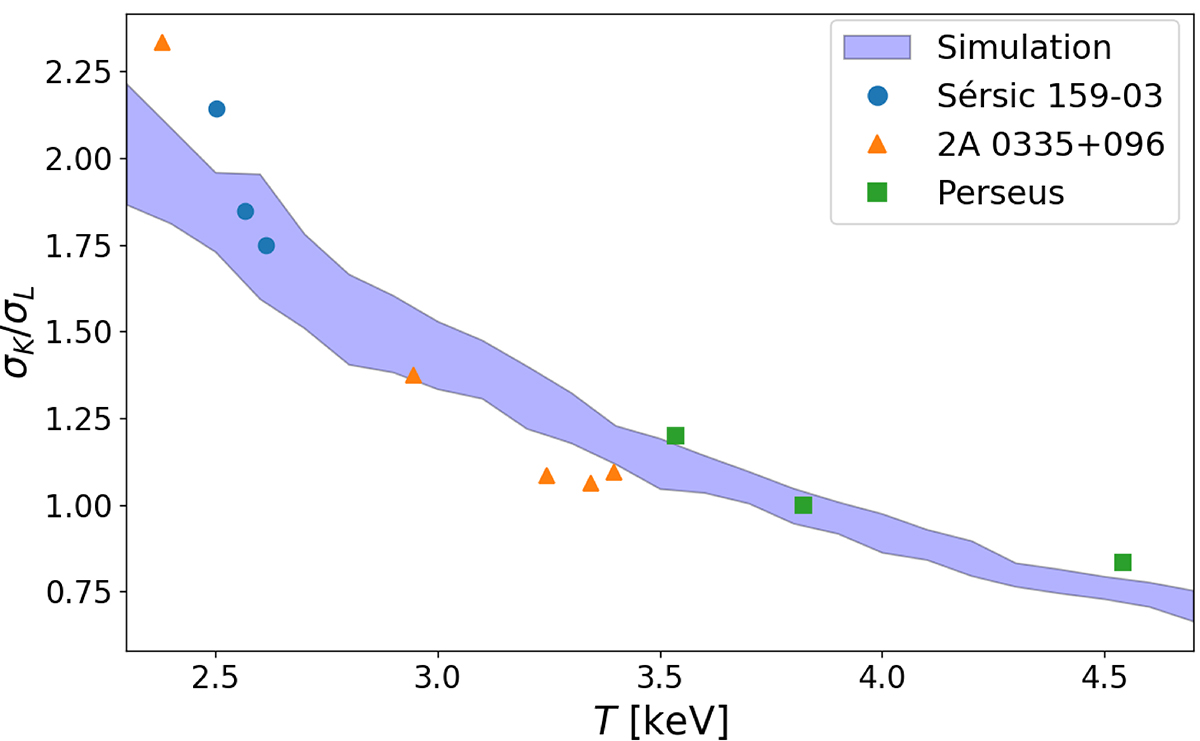
Fig. 5.
Download original image
Ratio of the statistical errors associated with the Kα- and L-shell-derived measurements, as a function of the ring temperatures, for the three clusters in our sample. The violet area represents σK/σL values (with their 1σ scatter) derived through high-S/B simulated spectra, as explained in the text. The errors are estimated following strategy 2 and through the joint fit of MOS and pn camera spectra of each region. For temperatures lower than ∼3.5 keV, the above ratio is higher than 1, meaning that the L-shell drives the abundance measurements.
Current usage metrics show cumulative count of Article Views (full-text article views including HTML views, PDF and ePub downloads, according to the available data) and Abstracts Views on Vision4Press platform.
Data correspond to usage on the plateform after 2015. The current usage metrics is available 48-96 hours after online publication and is updated daily on week days.
Initial download of the metrics may take a while.