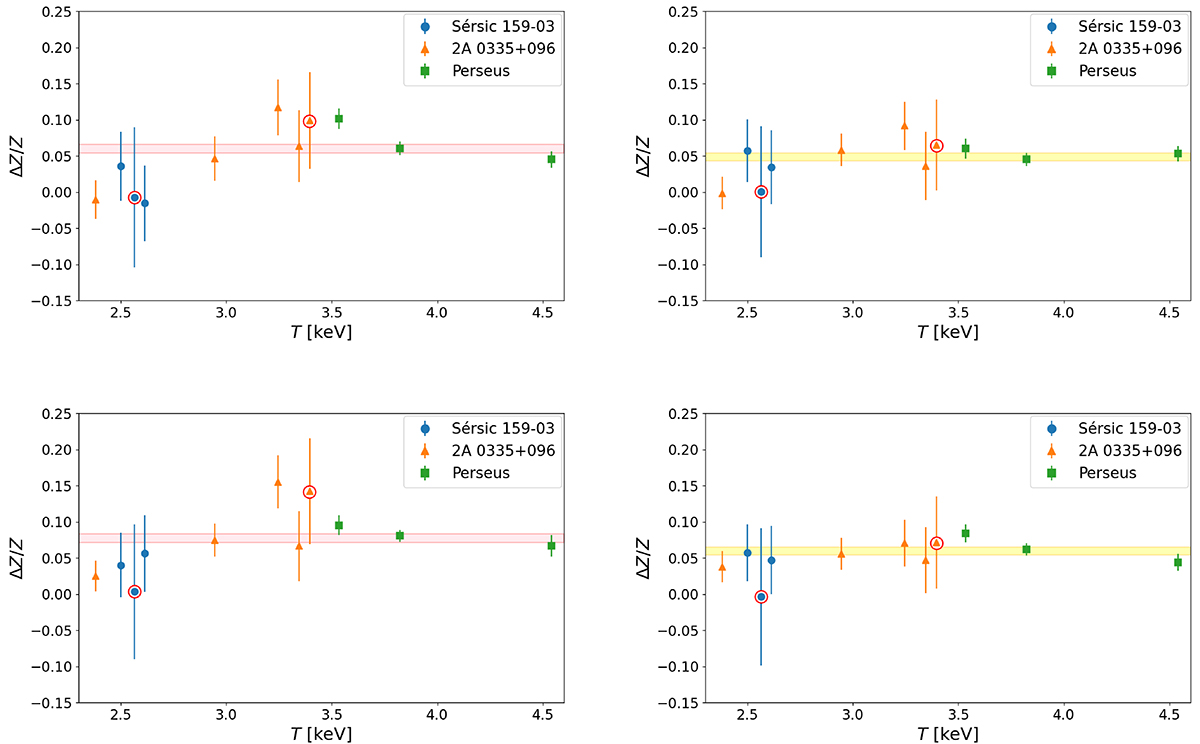
Fig. 3.
Download original image
Systematic error ΔZ/Z associated with the L-shell as a function of the temperature. Top and bottom rows: different fitting options (individual and joint fit of the MOS and pn spectra of each region, respectively), left and right column: refers to strategy 1 and 2, respectively. The pink and the yellow regions represent the weighted averages of the results, together with their 1σ errors.
Current usage metrics show cumulative count of Article Views (full-text article views including HTML views, PDF and ePub downloads, according to the available data) and Abstracts Views on Vision4Press platform.
Data correspond to usage on the plateform after 2015. The current usage metrics is available 48-96 hours after online publication and is updated daily on week days.
Initial download of the metrics may take a while.