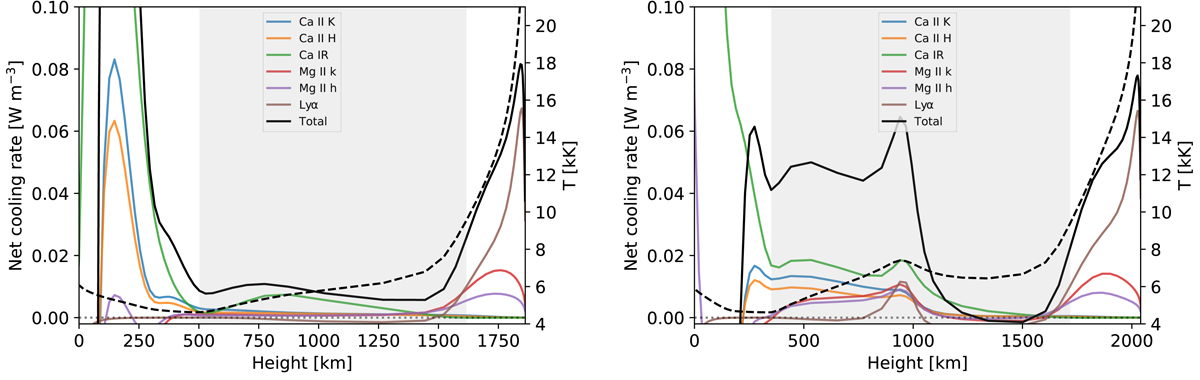
Fig. 2.
Download original image
Stratification of the net radiative cooling rates per unit volume for a quiet-Sun pixel (left panel) and a pixel located at the flare footpoint (right panel) indicated by the asterisk symbol in Fig. 1. The solid colored lines refer to different spectral lines. The solid black line represents the total cooling rate, whereas the dashed curve refers to the temperature stratification. The gray shaded area indicates the integrated heights.
Current usage metrics show cumulative count of Article Views (full-text article views including HTML views, PDF and ePub downloads, according to the available data) and Abstracts Views on Vision4Press platform.
Data correspond to usage on the plateform after 2015. The current usage metrics is available 48-96 hours after online publication and is updated daily on week days.
Initial download of the metrics may take a while.