Fig. 1.
Download original image
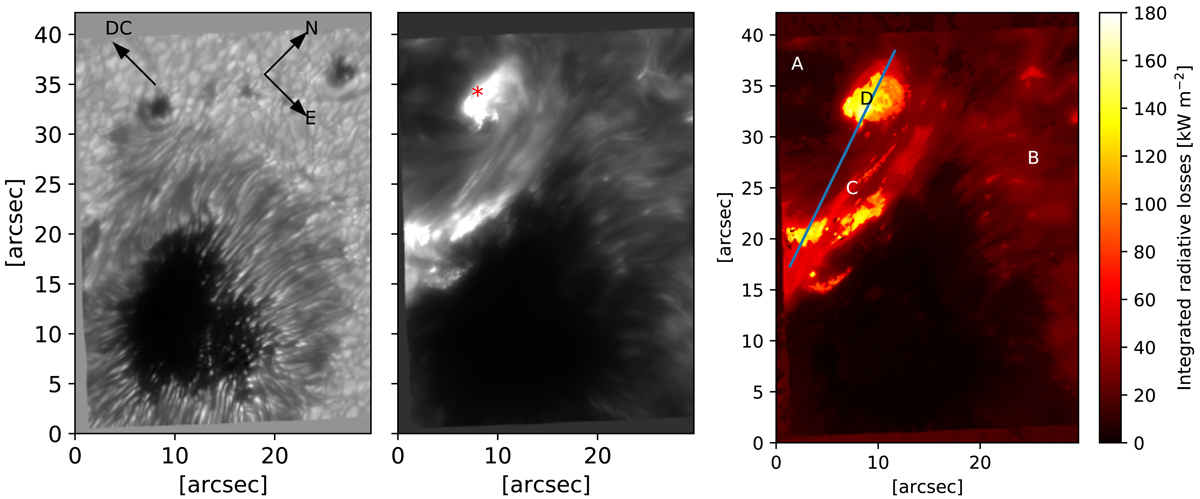
Overview of the flare observed at 08:46Sect. UT on May 6, 2019. The continuum intensity map (left panel) and the Chromospheric intensity map (middle panel) near the line core of Ca II K, observed using the SST. Right panel: integrated radiative losses estimated from the inferred semiempirical model atmosphere. Solar north, solar east, and the direction of the disk center are indicated by “N,” “E,” and “DC,” respectively. The red asterisk symbol in the middle panel shows the location of pixels analyzed to investigate the temporal evolution of the integrated radiative losses. The mean values of the total integrated losses at the A, B, C, and D locations (5 × 5 pixels) are listed in Table 1.
Current usage metrics show cumulative count of Article Views (full-text article views including HTML views, PDF and ePub downloads, according to the available data) and Abstracts Views on Vision4Press platform.
Data correspond to usage on the plateform after 2015. The current usage metrics is available 48-96 hours after online publication and is updated daily on week days.
Initial download of the metrics may take a while.