Fig. A.1
Download original image
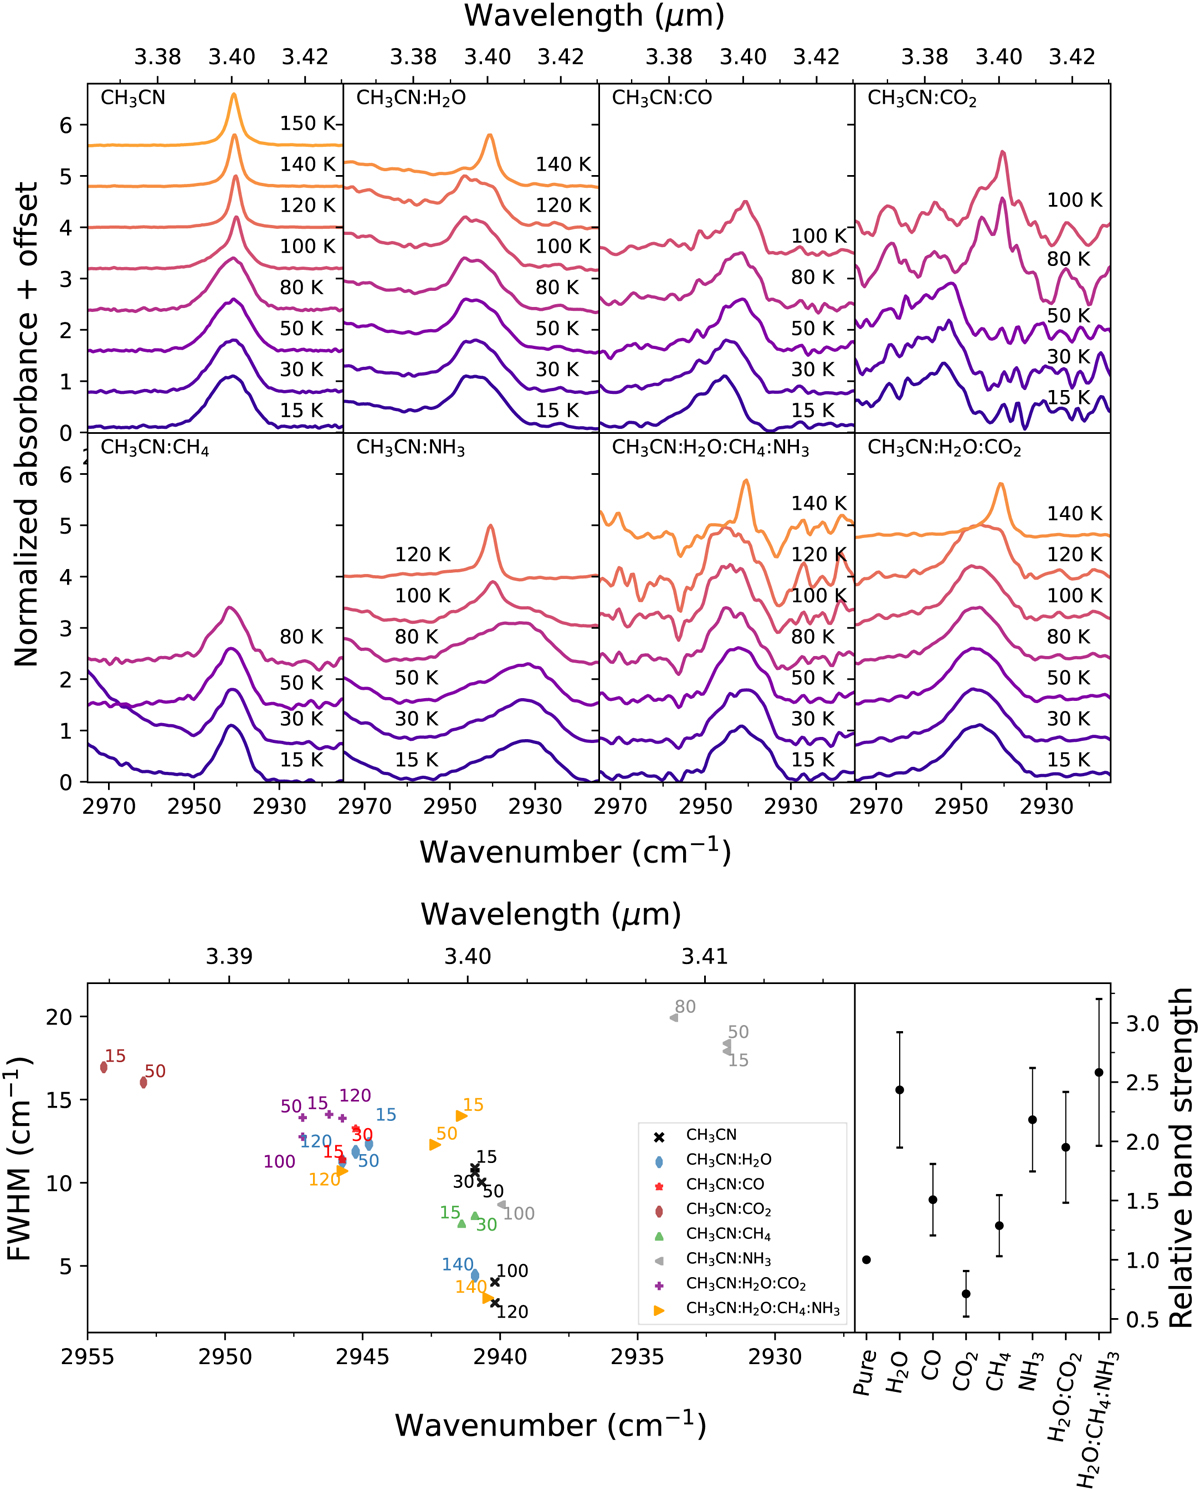
Upper panel: Absorption profile of the C–H symmetric stretch mode of methyl cyanide, around 2940.9 cm−1 (3.400 µm), in pure and mixed ices. The ice spectra at different temperatures are indicated by different colors and labels. Bottom left: Peak position and FWHM of the C–H symmetric stretching mode of CH3CN in different ice mixtures at selected temperatures. Bottom right: relative band strengths of the C–H symmetric stretch band in different ice mixtures at 15 K.
Current usage metrics show cumulative count of Article Views (full-text article views including HTML views, PDF and ePub downloads, according to the available data) and Abstracts Views on Vision4Press platform.
Data correspond to usage on the plateform after 2015. The current usage metrics is available 48-96 hours after online publication and is updated daily on week days.
Initial download of the metrics may take a while.