Fig. 5
Download original image
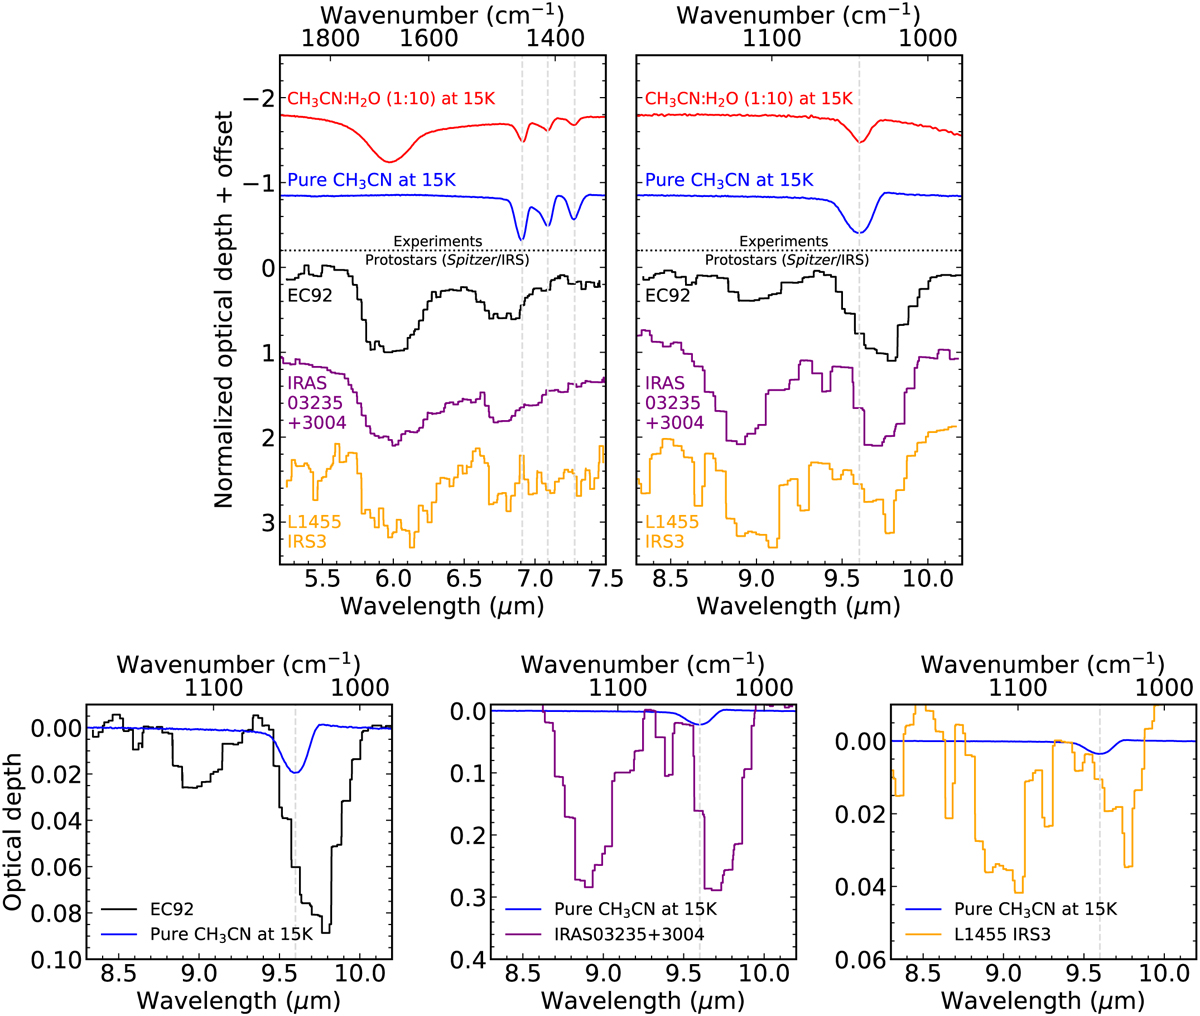
Comparison between the normalized Spitzer/IRS spectrum of three YSOs (EC92, IRAS03235+3004, and L1455 IRS3) and laboratory spectra of CH3CN ice. Top panels: the CH3CN and CH3CN:H2O ice spectra at 15 K are plotted with the YSO spectra (the continuum, and contributions from H2O, and silicate features are subtracted). The 6.90, 7.09, 7.27, 9.60 µm features of CH3CN are marked with a vertical dashed line. Bottom panels: Spitzer/IRS spectrum of EC92, IRAS03235+3004, and L1455 IRS3 (from left to right) in the 8.5–10 region. In addition, the laboratory spectrum of pure CH3CN ice at 15 K (blue) is shown. In the bottom panels, the spectrum of CH3CN is scaled to the observations using the 9.60 µm band of methyl cyanide.
Current usage metrics show cumulative count of Article Views (full-text article views including HTML views, PDF and ePub downloads, according to the available data) and Abstracts Views on Vision4Press platform.
Data correspond to usage on the plateform after 2015. The current usage metrics is available 48-96 hours after online publication and is updated daily on week days.
Initial download of the metrics may take a while.