Fig. 4
Download original image
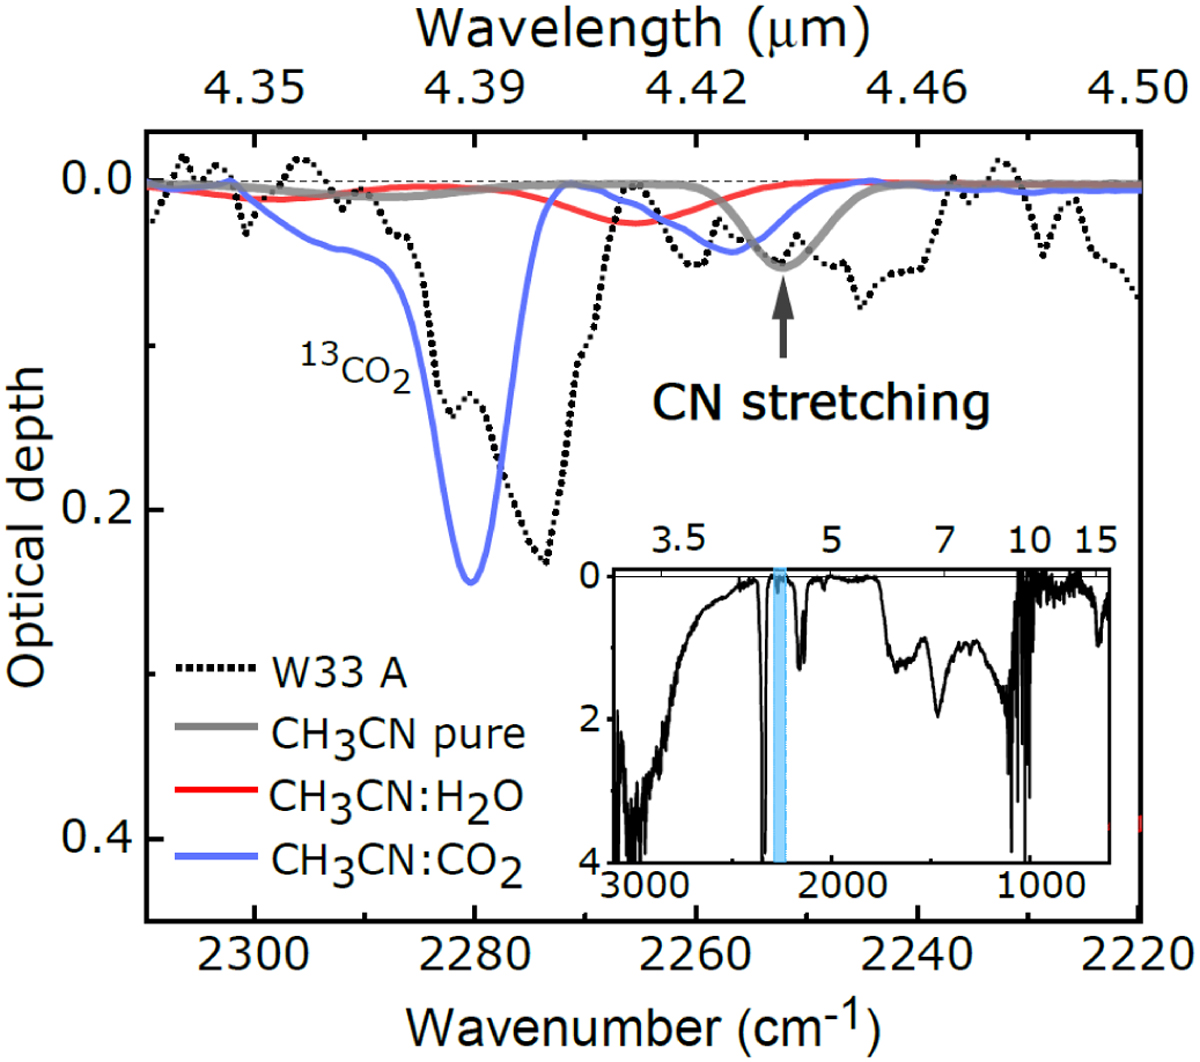
ISO spectrum of W33A with subtraction of a local linear continuum between 4.48–4.35 µm (dotted line). The laboratory spectra of CH3CN (gray), CH3CN:H2O (red) and CH3CN:CO2 (blue) at 15 K are also shown. The CN stretching of methyl cyanide ice in the laboratory spectrum, used for deriving upper limits for this species toward W33A, is indicated with an arrow. The inset in the bottom right shows the complete spectrum of ices toward W33A. The region analyzed for deriving CH3CN upper limits is indicated by the shadowed area.
Current usage metrics show cumulative count of Article Views (full-text article views including HTML views, PDF and ePub downloads, according to the available data) and Abstracts Views on Vision4Press platform.
Data correspond to usage on the plateform after 2015. The current usage metrics is available 48-96 hours after online publication and is updated daily on week days.
Initial download of the metrics may take a while.