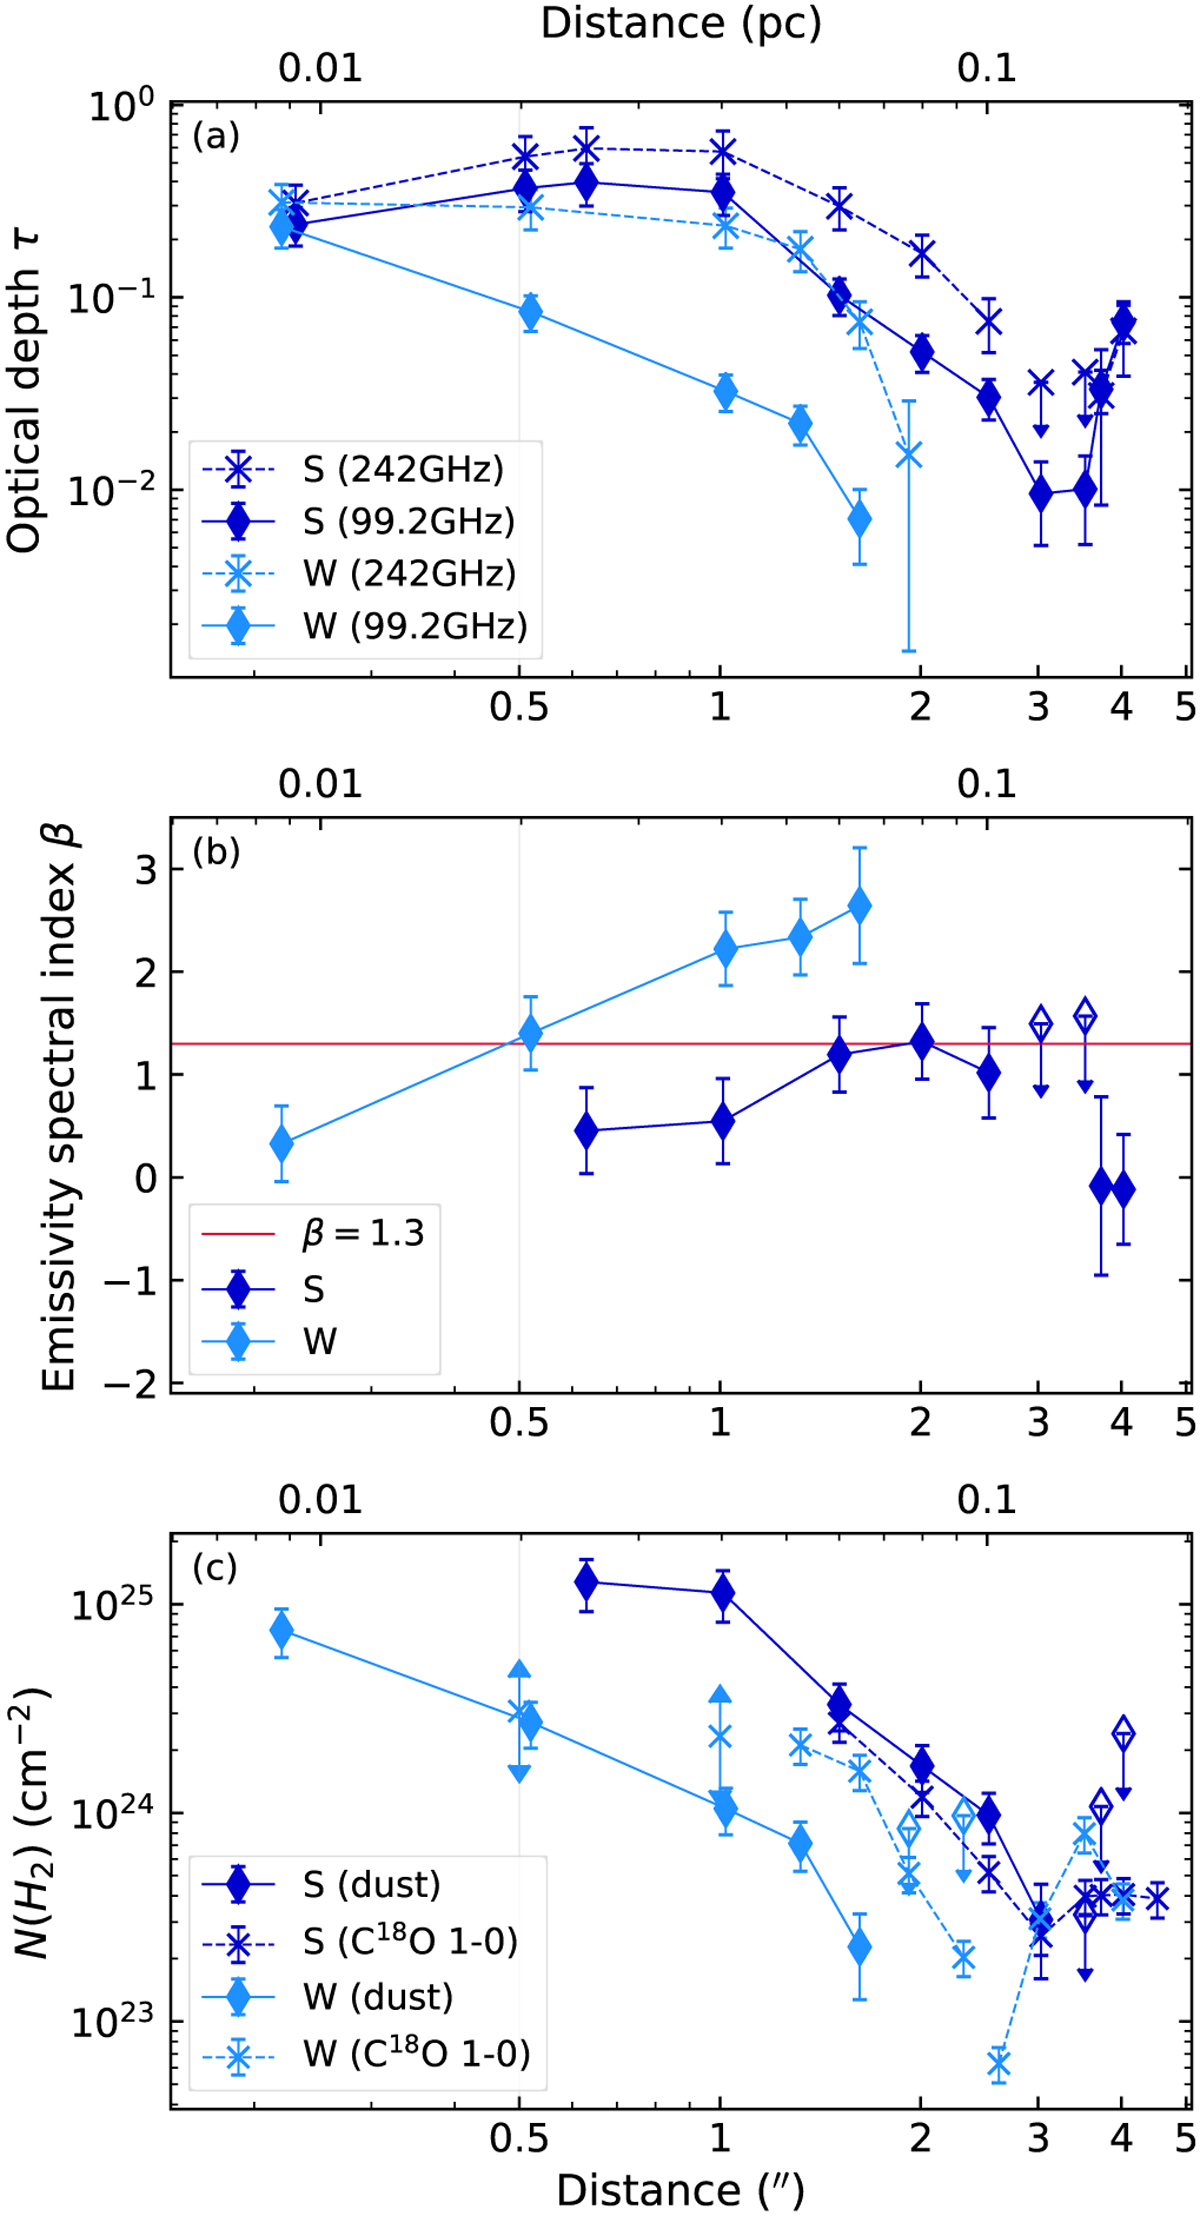
Fig. 8
Download original image
Physical properties of Sgr B2 (N1) derived from dust continuum emission and C18O 1–0 emission. Panel a: optical depth t as a function of distance from Sgr B2 (N1) in south (S) and west (W) directions and for the 1.3 mm and 3 mm continua, respectively. The 3 mm data have been corrected for free-free emission. Panel b: emissivity spectral index β as a function of distance from Sgr B2 (N1) derived from the optical depth ratio of the 1.3 mm and 3 mm data shown in (a). Panel c: H2 column densities derived from the 3 mm continuum emission, using β = 1.3 (adopted from Bonfand et al. 2019, see text), and from C18O 1–0 emission using conversion factors of C16O/C18O = 250 ± 30 (Henkel et al. 1994) and H2/C16O = 104 (Rodríguez-Fernández et al. 2001). The break in the (dashed) westbound profile indicates the observed velocity shift of the line from ~64 to 69 km s−1. In all panels upper and lower limits are indicated with arrows.
Current usage metrics show cumulative count of Article Views (full-text article views including HTML views, PDF and ePub downloads, according to the available data) and Abstracts Views on Vision4Press platform.
Data correspond to usage on the plateform after 2015. The current usage metrics is available 48-96 hours after online publication and is updated daily on week days.
Initial download of the metrics may take a while.