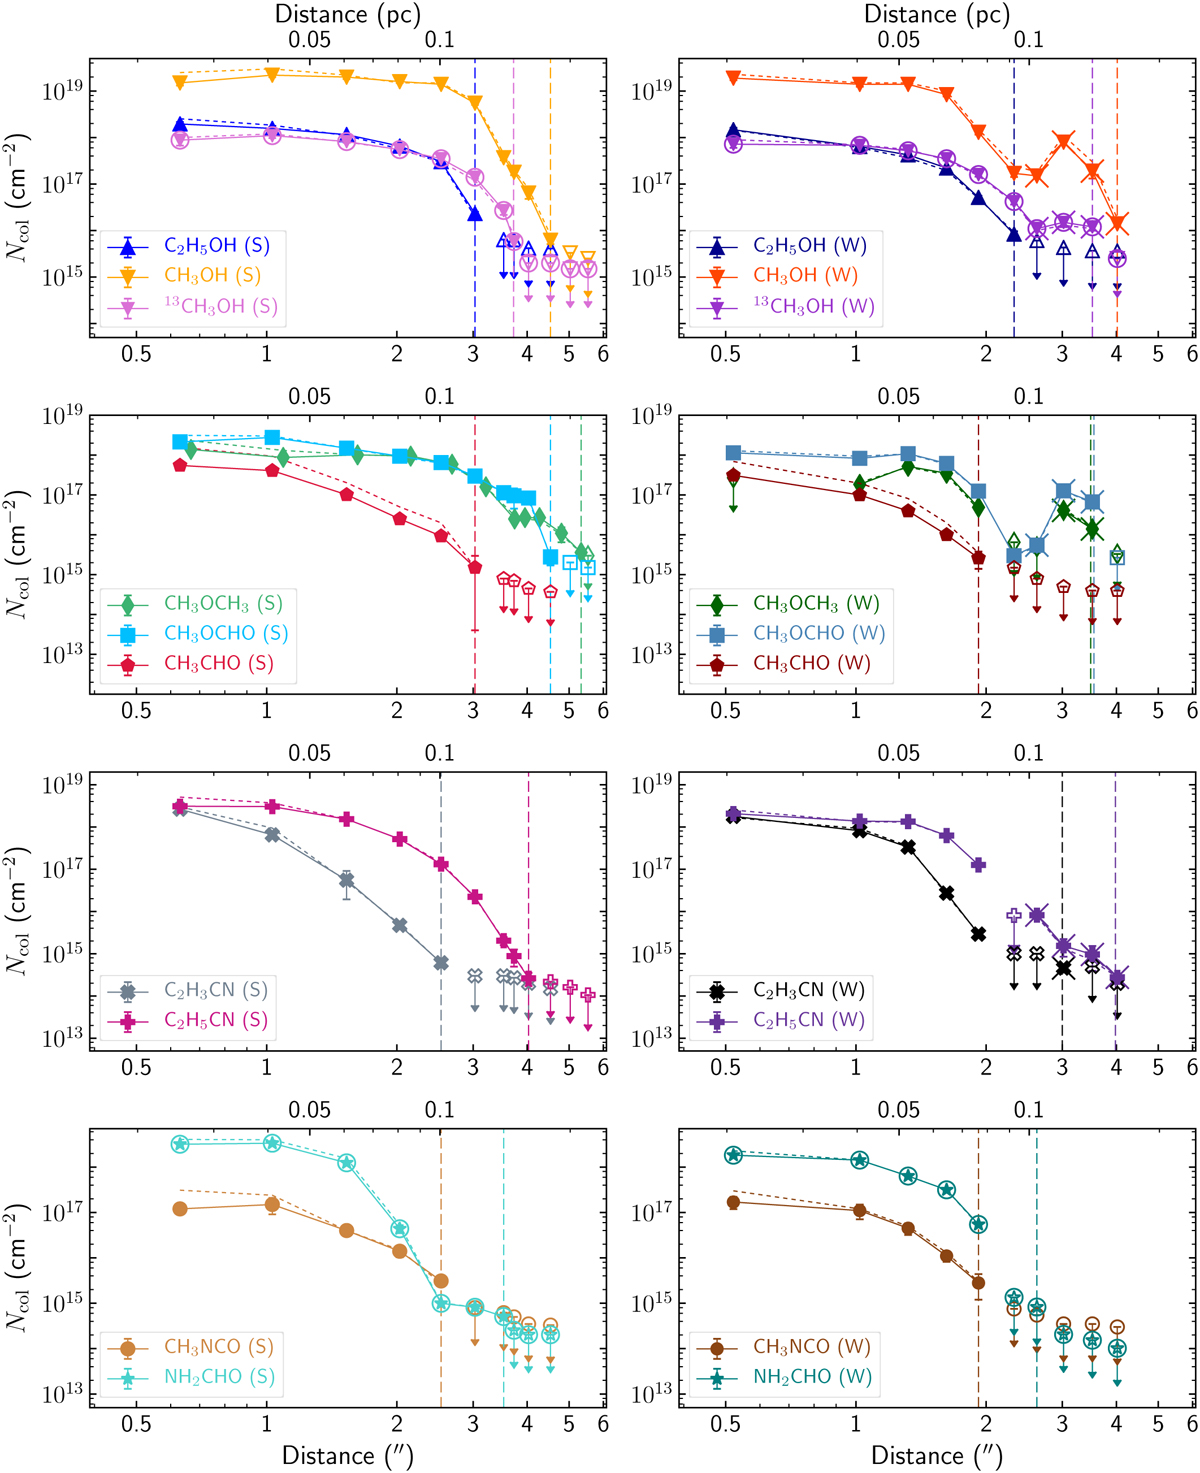
Fig. 7
Download original image
COM column density profiles to the south (S) and west (W), where solid curves show the total column densities derived from the linear fit in the population diagrams using setups 1–3 for 13CH3OH and NH2CHO (encircled symbols) and setups 4-5 for the rest of the COMs. Dotted curves indicate column densities used during the radiative transfer modelling with Weeds. Additional crosses on the markers indicate positions for which the velocity offset changed from ≲2 to ~7 km s−1. Isolated unfilled markers with arrows indicate upper limits. Vertical lines mark the distance from Sgr B2 (N1) beyond which a COM is no longer detected.
Current usage metrics show cumulative count of Article Views (full-text article views including HTML views, PDF and ePub downloads, according to the available data) and Abstracts Views on Vision4Press platform.
Data correspond to usage on the plateform after 2015. The current usage metrics is available 48-96 hours after online publication and is updated daily on week days.
Initial download of the metrics may take a while.