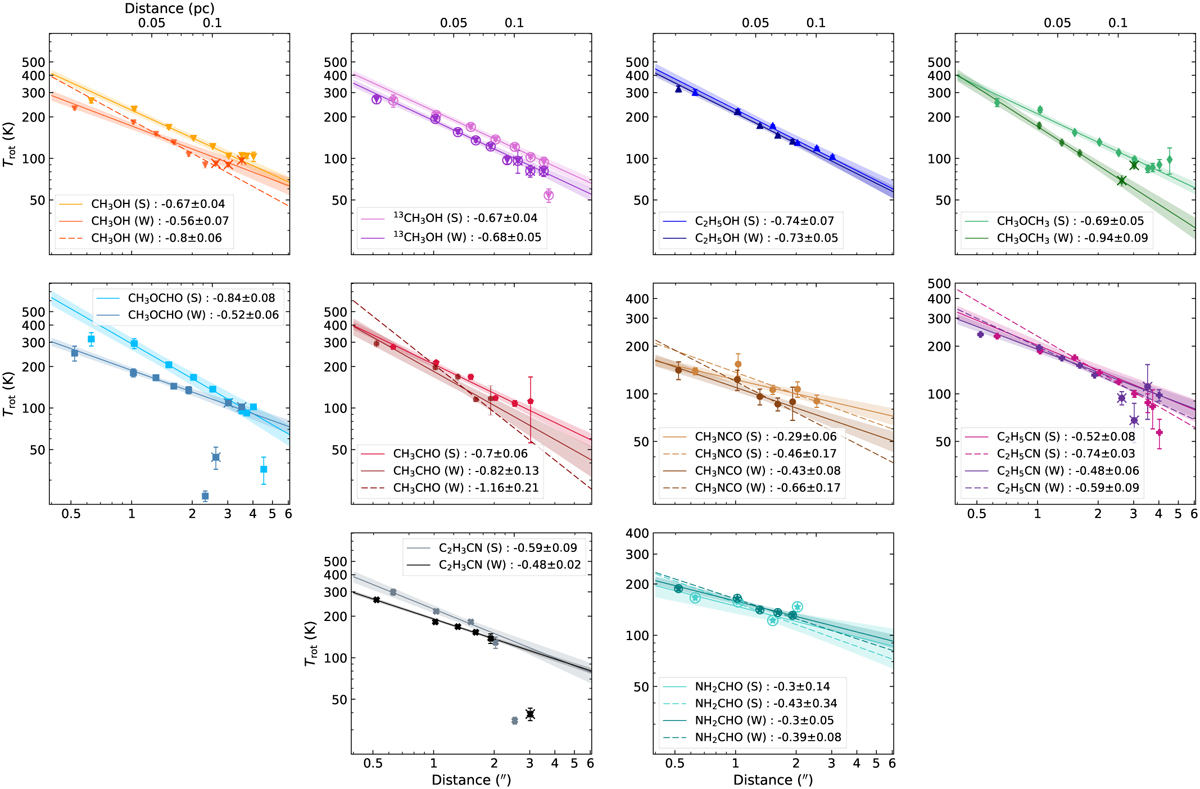
Fig. 6

Download original image
Rotational temperature profiles to the south (S) and west (W), where temperatures for all COMs are taken from the linear fit in the population diagrams using setups 4-5, except for 13CH3OH and NH2CHO, for which setups 1-3 have to be used (encircled symbols). Solid lines show the fit including all positions up to N1W4 (except for CH3OCHO and C2H5CN) to the west and up to N1S4 to the south while dashed lines indicate the fit using only positions beyond 1″ (CH3OH (W), CH3CHO (W), CH3NCO (W), C2H5CN (W), NH2CHO) or 1.5″ (C2H5CN (S)) and up to N1S4 and N1W4, respectively. Additional crosses on the markers indicate positions for which the velocity offset changed from ≲2 to ~7 km s−1. The shaded areas indicate the uncertainty on the fit using all positions. The fit results are shown in the respective legend and are summarised in Table 2.
Current usage metrics show cumulative count of Article Views (full-text article views including HTML views, PDF and ePub downloads, according to the available data) and Abstracts Views on Vision4Press platform.
Data correspond to usage on the plateform after 2015. The current usage metrics is available 48-96 hours after online publication and is updated daily on week days.
Initial download of the metrics may take a while.


