Fig. 5
Download original image
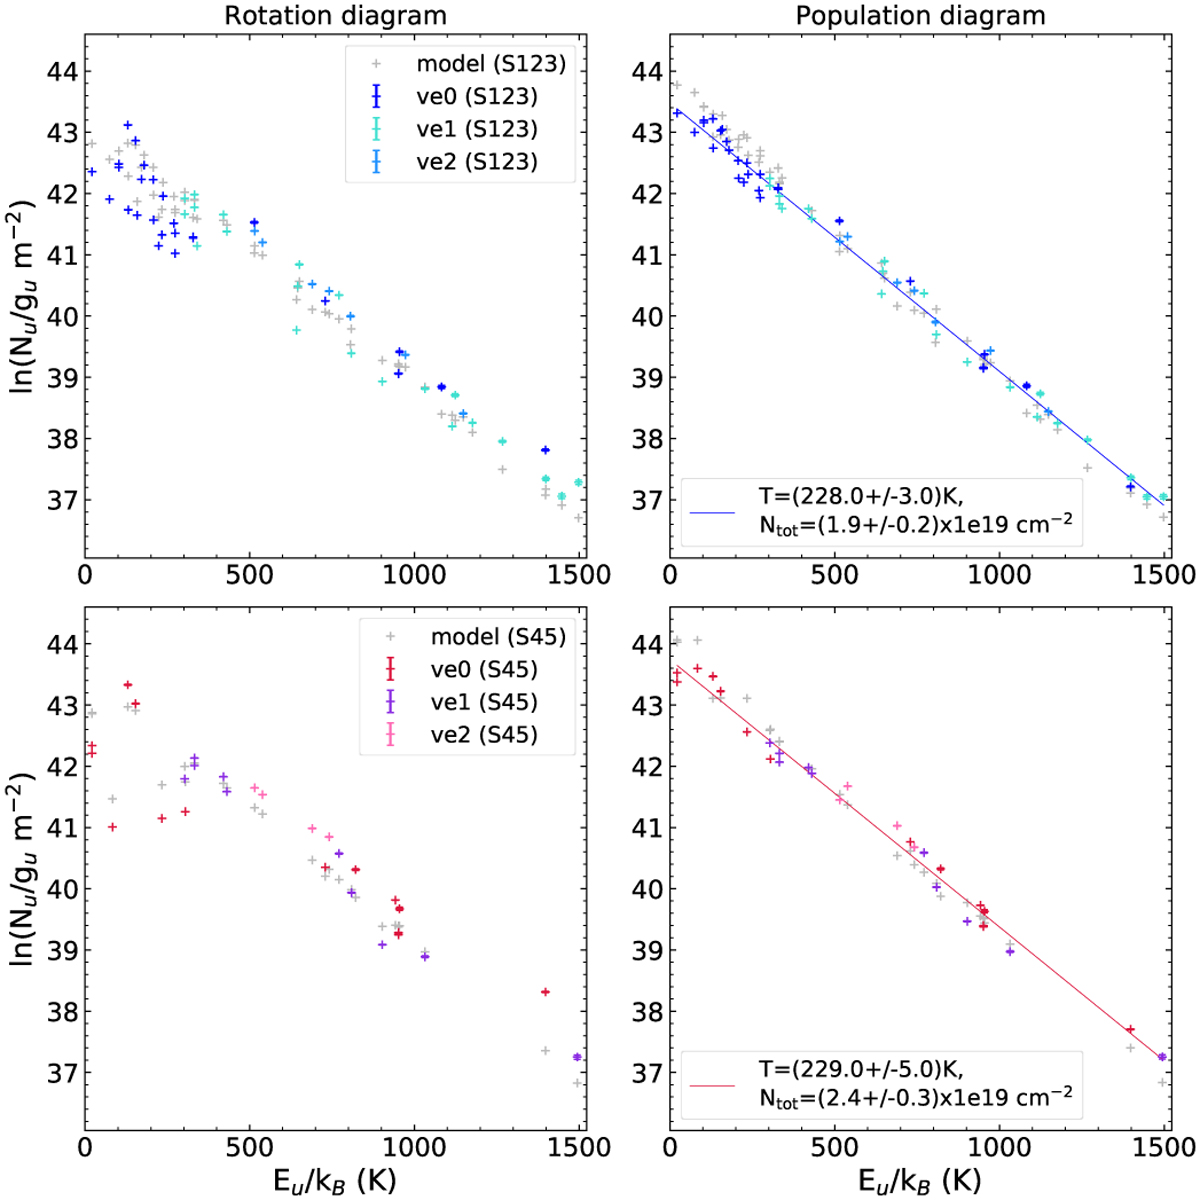
Population diagram for CH3OH towards Sgr B2 (N1S), where setups 1–3 and 4–5 are considered separately in the upper and lower row, respectively. Observed data points are shown in colours as indicated in the upper right corner in the left panel while the synthetic data points are shown in grey. No corrections are applied in the left panel while in the right panel corrections for opacity and contamination by other molecules have been considered for both the observed and synthetic populations. The blue and red lines are linear fits to the observed data points (in linear-logarithmic space) obtained with setups 1–3 and 4–5, respectively. The results of the fit are shown in the right panels.
Current usage metrics show cumulative count of Article Views (full-text article views including HTML views, PDF and ePub downloads, according to the available data) and Abstracts Views on Vision4Press platform.
Data correspond to usage on the plateform after 2015. The current usage metrics is available 48-96 hours after online publication and is updated daily on week days.
Initial download of the metrics may take a while.