Fig. 4
Download original image
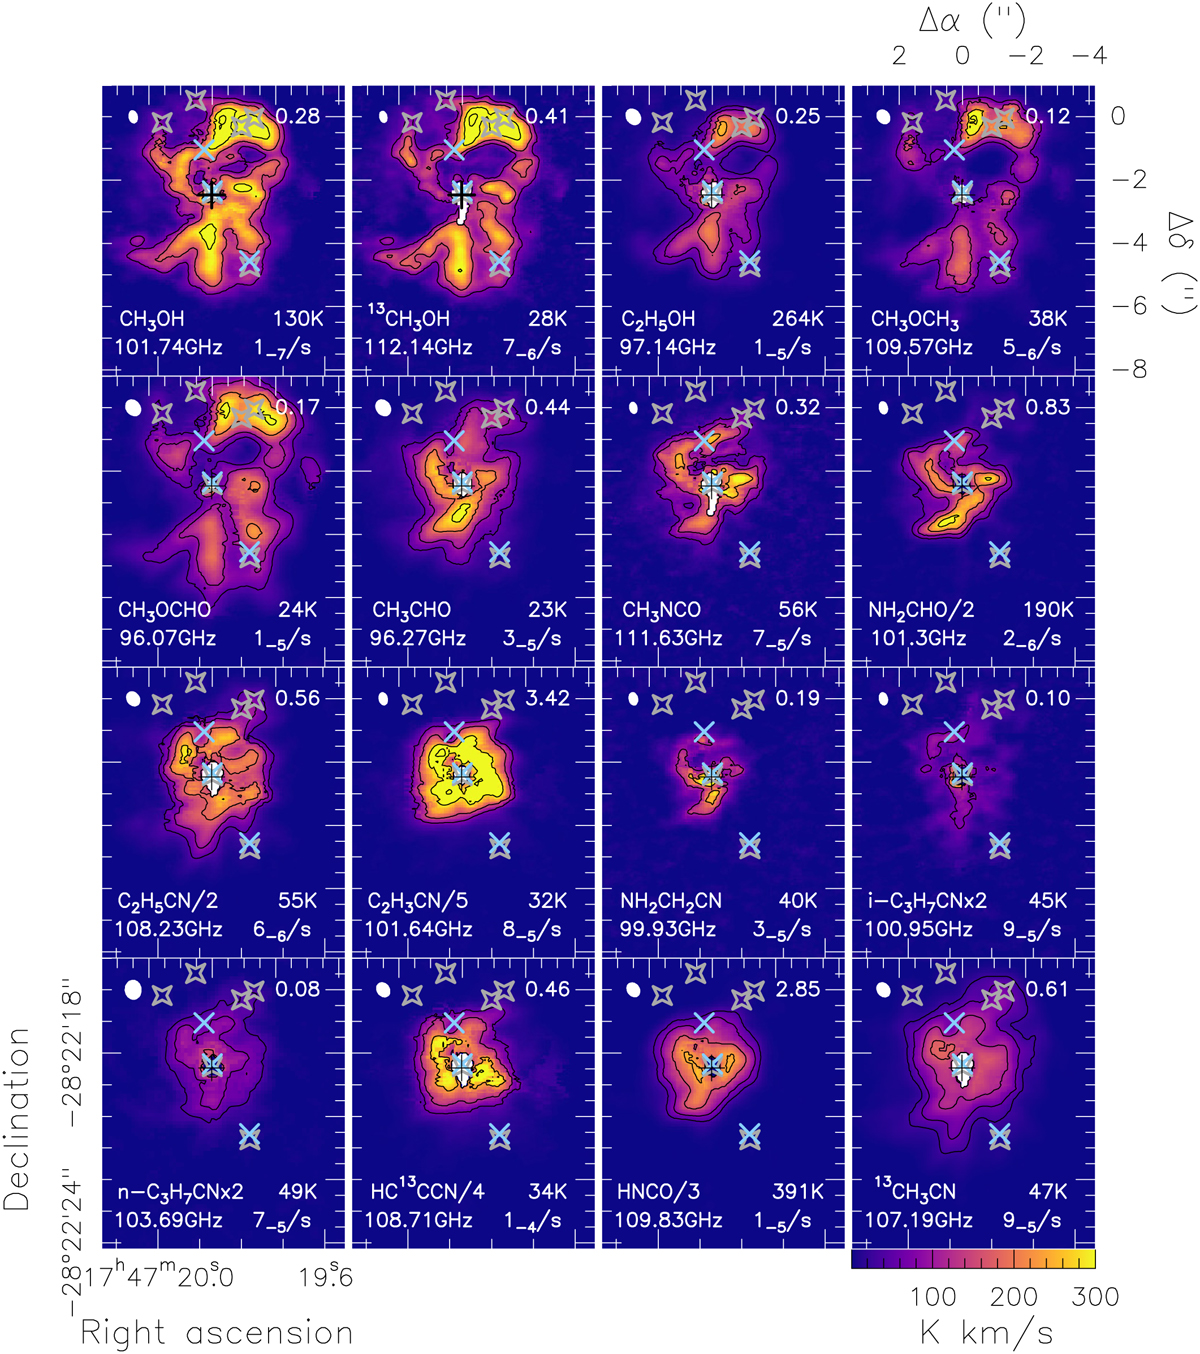
LVINE maps of various COMs. Integrated intensities of C2H5CN are scaled down by a factor of 2, those of C2H3CN by a factor 5, HC13CCN by a factor 4, HNCO by a factor 3, and NH2CHO by a factor 2. Integrated intensities of i-C3H7CN and n-C3H7CN are scaled up by a factor 2, respectively. Because the noise level within each map is not uniform due to the pixel-dependent integration limits, contours are at 15, 30, 60, and 90% of the respective peak intensity and additional signal-to-noise maps are shown in Fig. D.1. The name of the COM and the frequency of the used transition are shown in the lower left corner. Upper level energies and Einstein A coefficients (where x−y/s = x × 10−y s−1) are shown in the lower right, optical depth at position N1S in the upper right, and the synthesised beam in the upper left corner. The closest region around Sgr B2 (N1) is masked out due to high frequency- and beam-size-dependent continuum optical depth (see Appendix C). The black cross indicates the position of Sgr B2 (N1) determined in this work. HII regions reported by Gaume et al. (1995) are shown with blue crosses, continuum sources reported by Sánchez-Monge et al. (2017) with grey polygons.
Current usage metrics show cumulative count of Article Views (full-text article views including HTML views, PDF and ePub downloads, according to the available data) and Abstracts Views on Vision4Press platform.
Data correspond to usage on the plateform after 2015. The current usage metrics is available 48-96 hours after online publication and is updated daily on week days.
Initial download of the metrics may take a while.