Fig. 3
Download original image
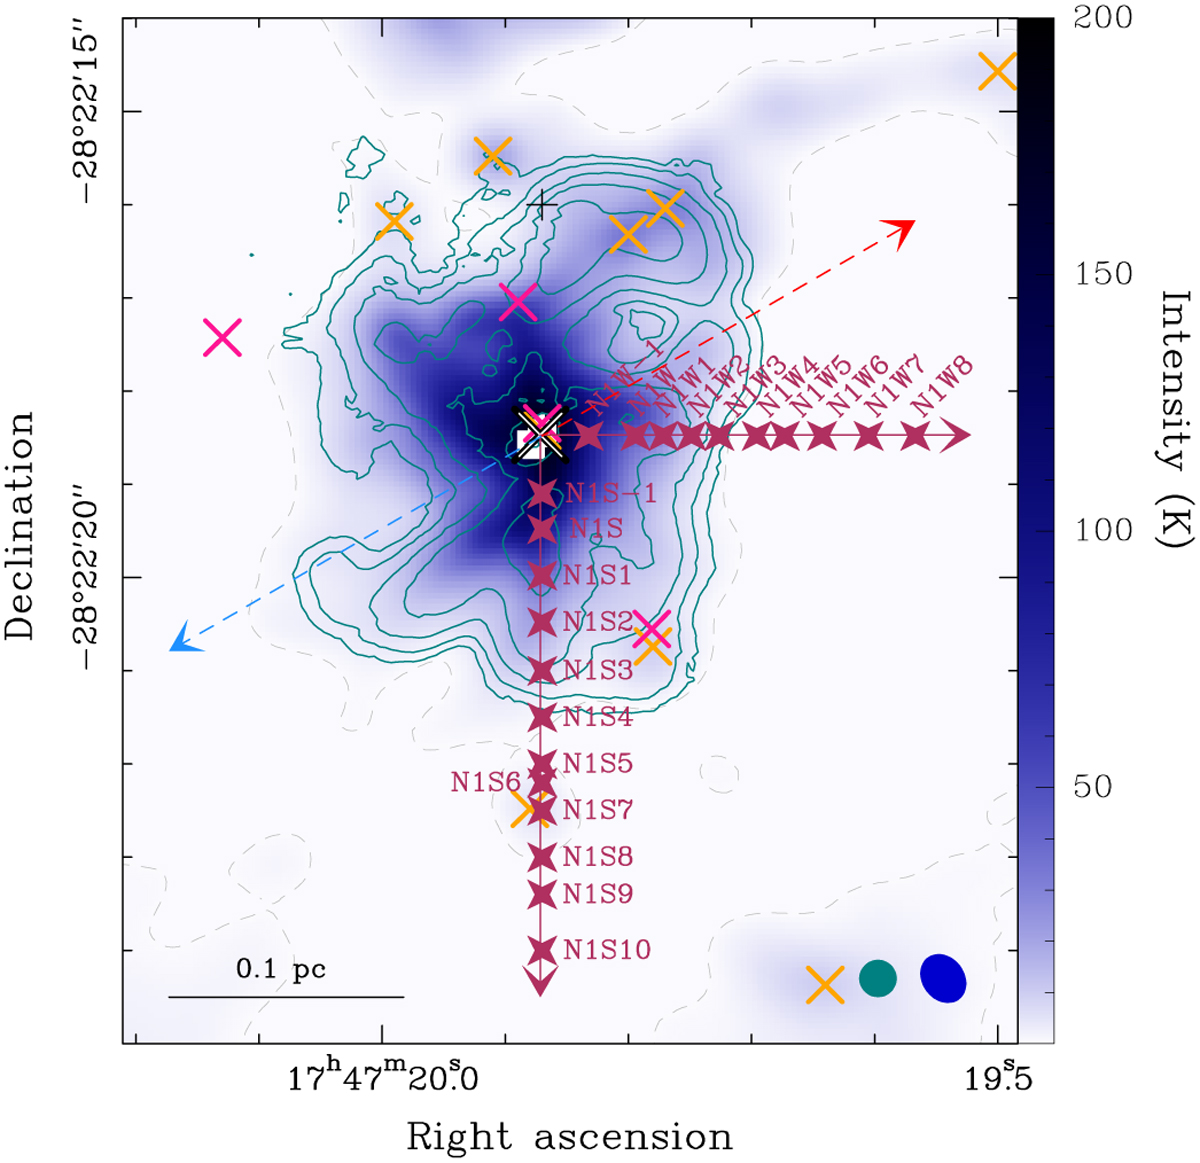
Continuum at 242 GHz (Sánchez-Monge et al. 2017) in colour scale overlaid by a Line-width- and Velocity-corrected INtegrated Emission (LVINE) map of C2H5OH (97.139 GHz, Eu = 264 K) shown with teal contours. The contour steps start at 3σ and then increase by a factor of 2 with σ = 8.3 K km s−1. The grey dashed contour indicates the 3σ level of the continuum with σ = 12.7 mK. The closest region around Sgr B2 (N1) is masked out due to high continuum optical depth (see Appendix C). Coloured crosses indicate continuum sources introduced in Fig. 1. The black cross shows the phase centre of the ReMoCA observations. Red and blue dashed arrows indicate the outflow axis reported by Higuchi et al. (2015). The beams of the maps are shown in the respective colour in the lower right corner. Maroon arrows indicate the directions along which positions (maroon star symbols) are chosen for the subsequent analysis (see Sect. 3.3).
Current usage metrics show cumulative count of Article Views (full-text article views including HTML views, PDF and ePub downloads, according to the available data) and Abstracts Views on Vision4Press platform.
Data correspond to usage on the plateform after 2015. The current usage metrics is available 48-96 hours after online publication and is updated daily on week days.
Initial download of the metrics may take a while.