Fig. F.1
Download original image
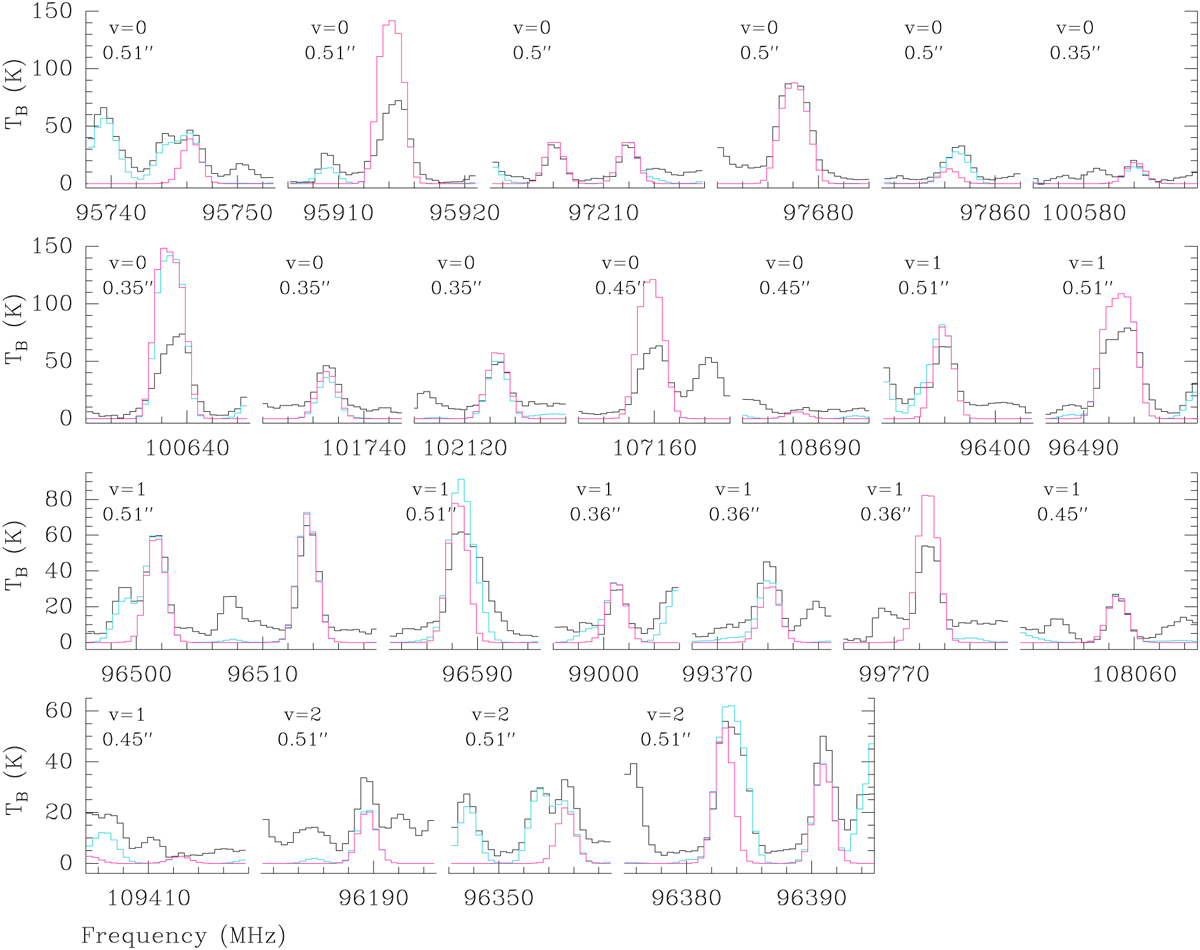
Transitions of CH3OH used to produce the population diagram at position N1S. The observed spectrum is shown in black, the synthetic spectrum of the shown molecule in pink, and the cumulative Weeds model of all COMs, whose spectra have been modelled in this work, in turquoise. The vibrational state and the beam size of the respective spectral window are shown in the upper left corner. The frequency axis shows steps of 2 MHz. Transitions marked with pink stars in Figs. F.2–F.10 are not used for the population diagram.
Current usage metrics show cumulative count of Article Views (full-text article views including HTML views, PDF and ePub downloads, according to the available data) and Abstracts Views on Vision4Press platform.
Data correspond to usage on the plateform after 2015. The current usage metrics is available 48-96 hours after online publication and is updated daily on week days.
Initial download of the metrics may take a while.