Fig. D.1
Download original image
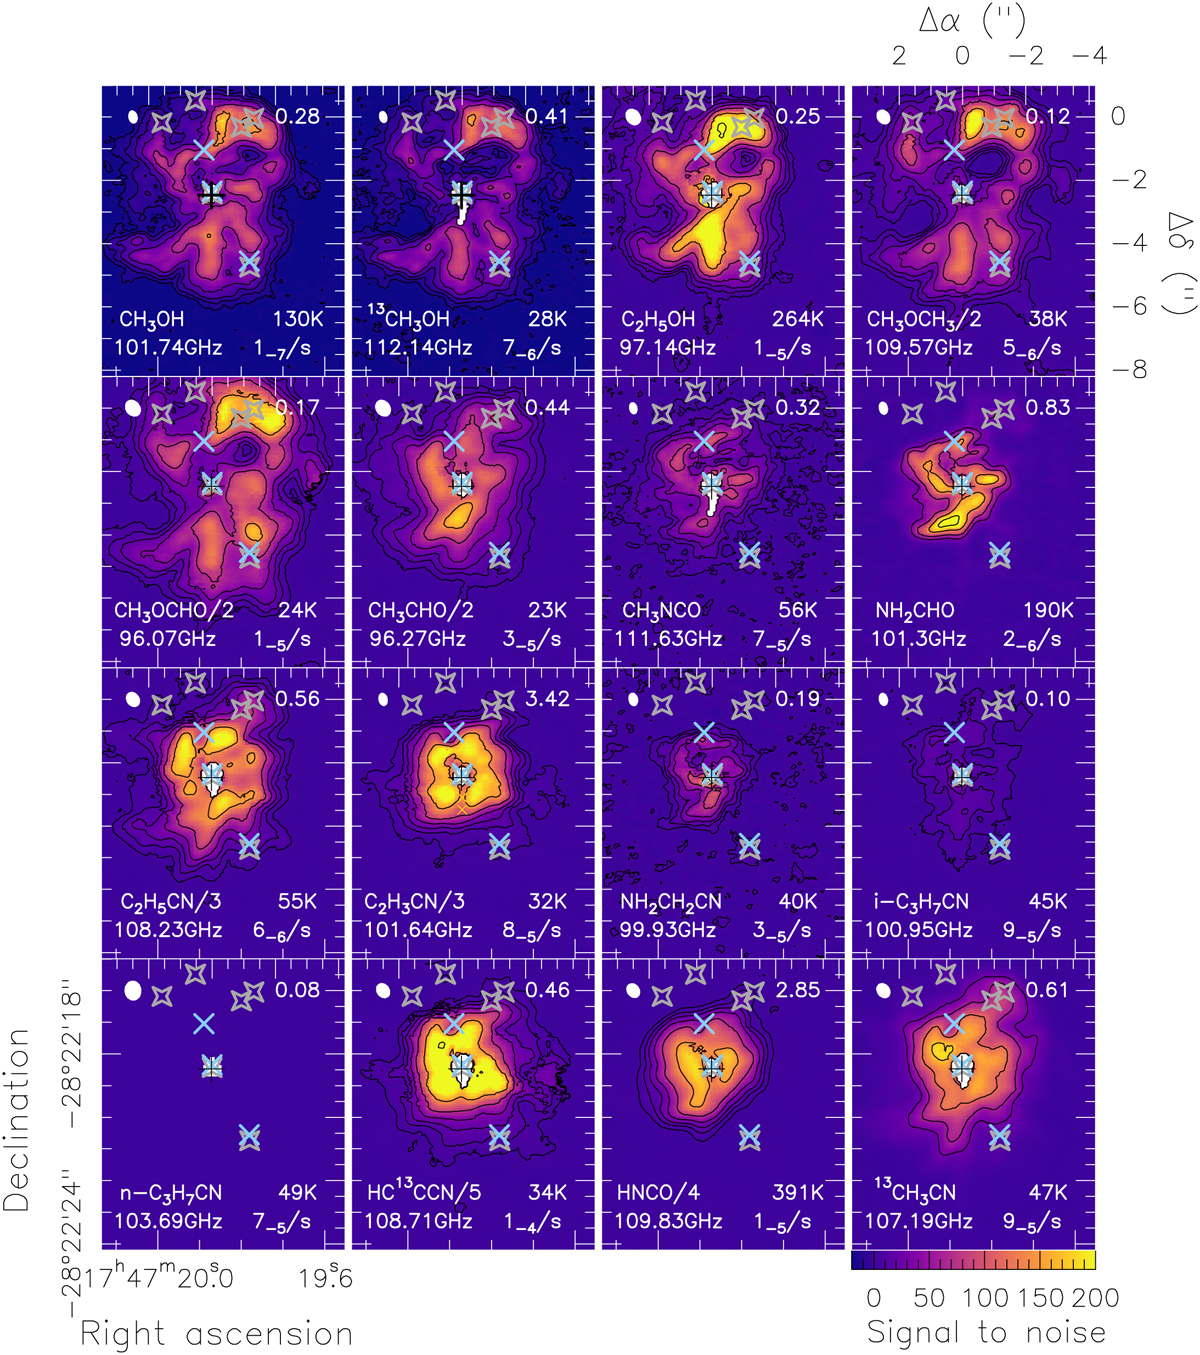
Same as Fig. 4, except that instead of integrated intensities the signal-to-noise ratio is shown. The noise is computed by, where N is the number of channels over which integration was performed, Av is the channel separation in km s−1, and σ is the median rms noise level as shown in Table 2 in Belloche et al. (2019). Values of CH3OCH3, CH3OCHO, and CH3CHO are scaled down by a factor of 2, those of C2H5CN and C2H3CN by a factor 3, HC13CCN by a factor 5, HNCO by a factor 4. The contour steps are 3, 9, 18, 36, 72, 144, 288, and 576.
Current usage metrics show cumulative count of Article Views (full-text article views including HTML views, PDF and ePub downloads, according to the available data) and Abstracts Views on Vision4Press platform.
Data correspond to usage on the plateform after 2015. The current usage metrics is available 48-96 hours after online publication and is updated daily on week days.
Initial download of the metrics may take a while.