Fig. 2
Download original image
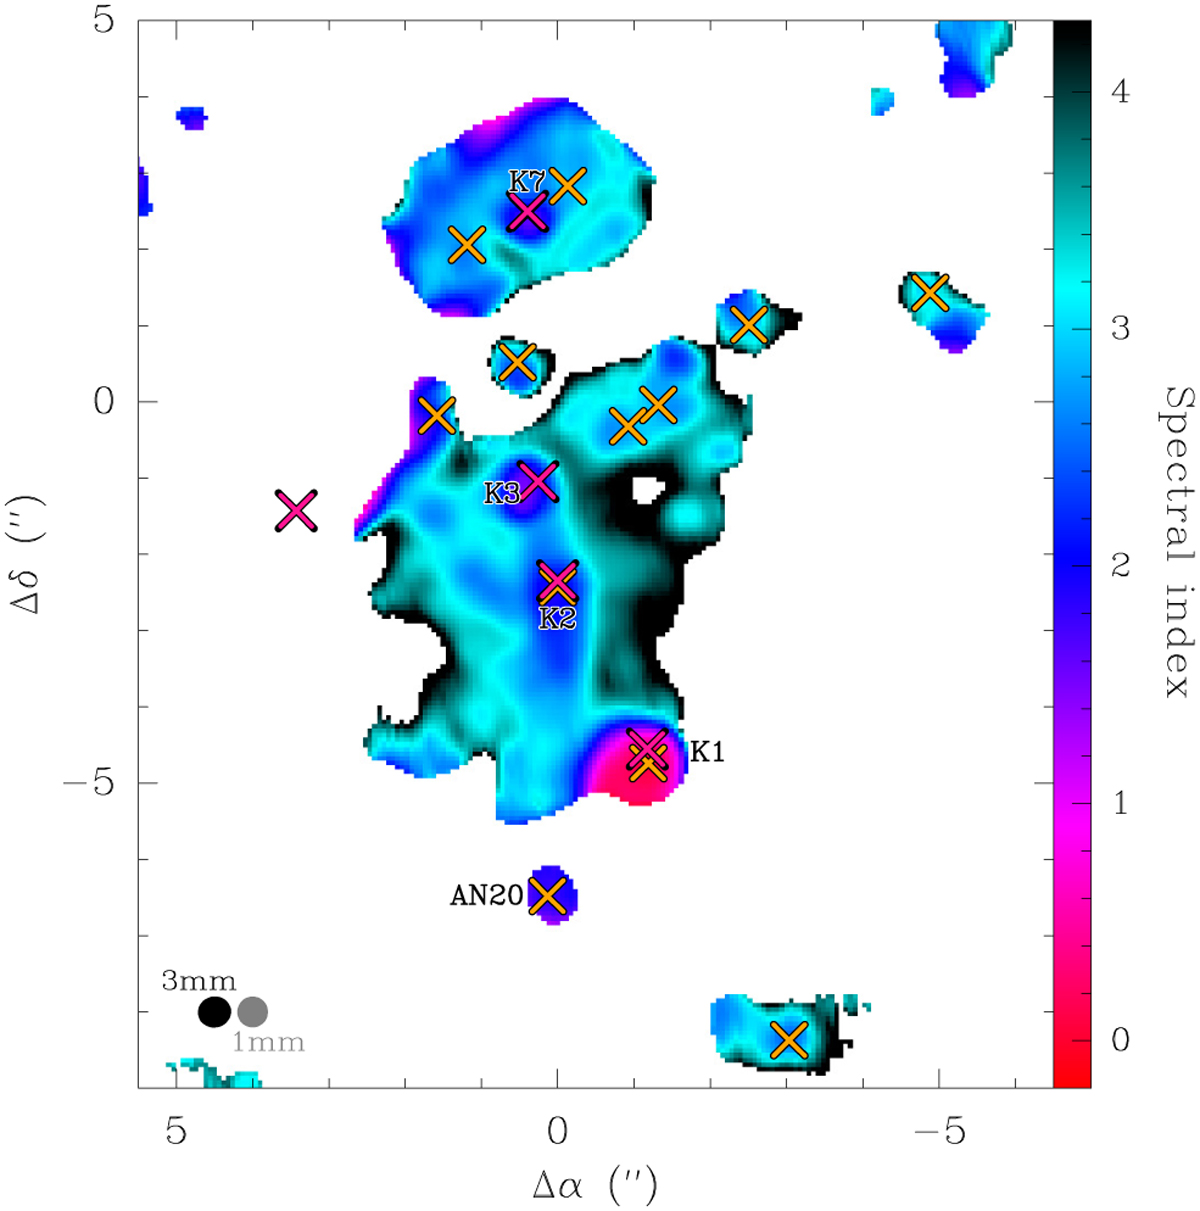
Spectral index map derived from the 1.3 and 3 mm continuum emission for the region around N1 and N2 indicated with the black box in Fig. 1. The crosses indicate the same sources of respective colour as in Fig. 1. The synthesised beams (after smoothing for the 3 mm map) are shown in the lower left corner. The position offsets are given with respect to the ReMoCA phase centre.
Current usage metrics show cumulative count of Article Views (full-text article views including HTML views, PDF and ePub downloads, according to the available data) and Abstracts Views on Vision4Press platform.
Data correspond to usage on the plateform after 2015. The current usage metrics is available 48-96 hours after online publication and is updated daily on week days.
Initial download of the metrics may take a while.