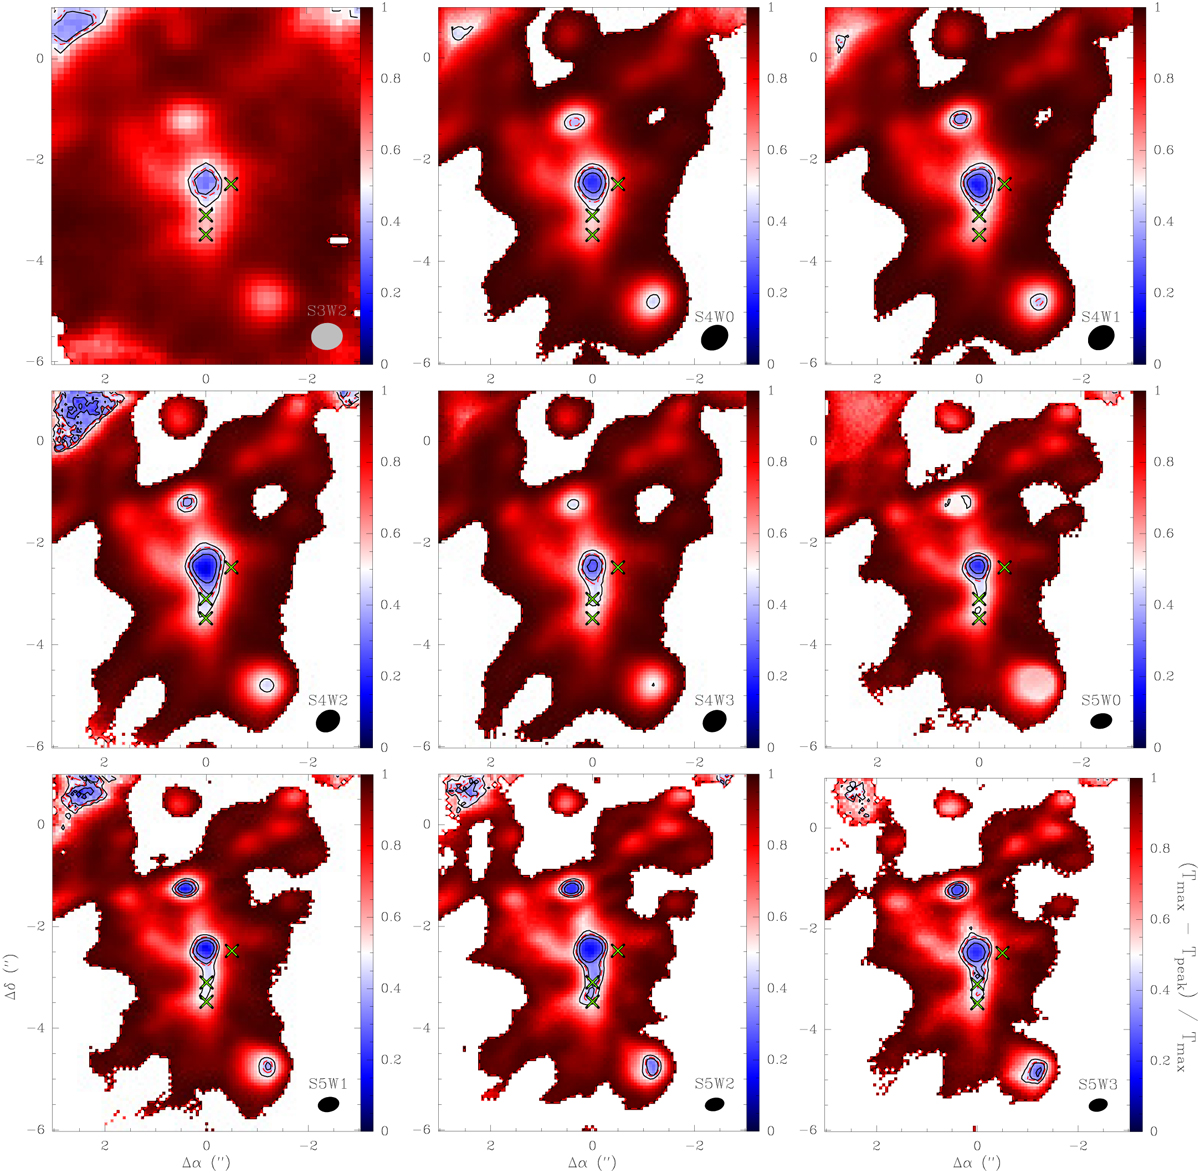
Fig. C.1
Download original image
Visualisation of the determination of the continuum emission mask needed because of high continuum optical depth towards Sgr B2 (N1). From the channel-intensity distribution of the continuum-included spectra, the intensity at the peak Tpeak and the maximum intensity Tmax were determined. The maps in colour-scale and the contours show the difference Tmax − Tpeak normalised by Tmax. This ratio was only computed when Tpeak > 3σ, where σ is the average noise level in the continuum emission map. The contour steps (black) are 0.3, 0.4, and 0.5. The red dashed contour at a value of 0.43 indicates the boundary of the adopted mask. Green crosses show positions N1S-1 and N1S to the south and N1W-1 to the west. The observational setup and spectral window are shown in the lower right corner together with the respective beam sizes. Only those spectral windows are shown from which molecular transitions are used to create integrated intensity maps (cf. Figs. 3 and 4).
Current usage metrics show cumulative count of Article Views (full-text article views including HTML views, PDF and ePub downloads, according to the available data) and Abstracts Views on Vision4Press platform.
Data correspond to usage on the plateform after 2015. The current usage metrics is available 48-96 hours after online publication and is updated daily on week days.
Initial download of the metrics may take a while.