Fig. B.2
Download original image
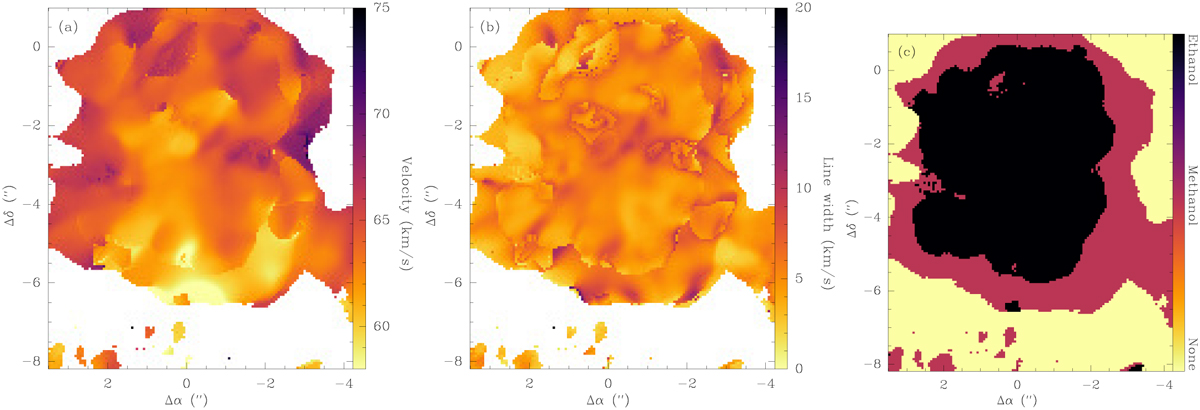
Peak velocity (a) and line-width map (b) of Sgr B2 (N1) created using the 108.44 GHz (Eu = 88 K) transition of C2H5OH (black region in c) and the 95.91 GHz (Eu = 21 K) transition of CH3OH (maroon region in c). The map in panel (c) shows at which positions in (a) and (b) either C2H5OH (black) or CH3OH (maroon) was used. The transition from ethanol to methanol happens when the fitted peak intensity of the ethanol line is less than 5σ, where σ is the median rms noise level listed in Table 2 in Belloche et al. (2019). At positions where neither C2H5OH nor CH3OH are detected above this threshold (yellow region) the peak velocity and line width were fixed to values of 64 km s−1 and 4 km s−1, respectively, to produce the LVINE maps shown in Fig. 4 and were blanked in a) and b).
Current usage metrics show cumulative count of Article Views (full-text article views including HTML views, PDF and ePub downloads, according to the available data) and Abstracts Views on Vision4Press platform.
Data correspond to usage on the plateform after 2015. The current usage metrics is available 48-96 hours after online publication and is updated daily on week days.
Initial download of the metrics may take a while.