Fig. B.1
Download original image
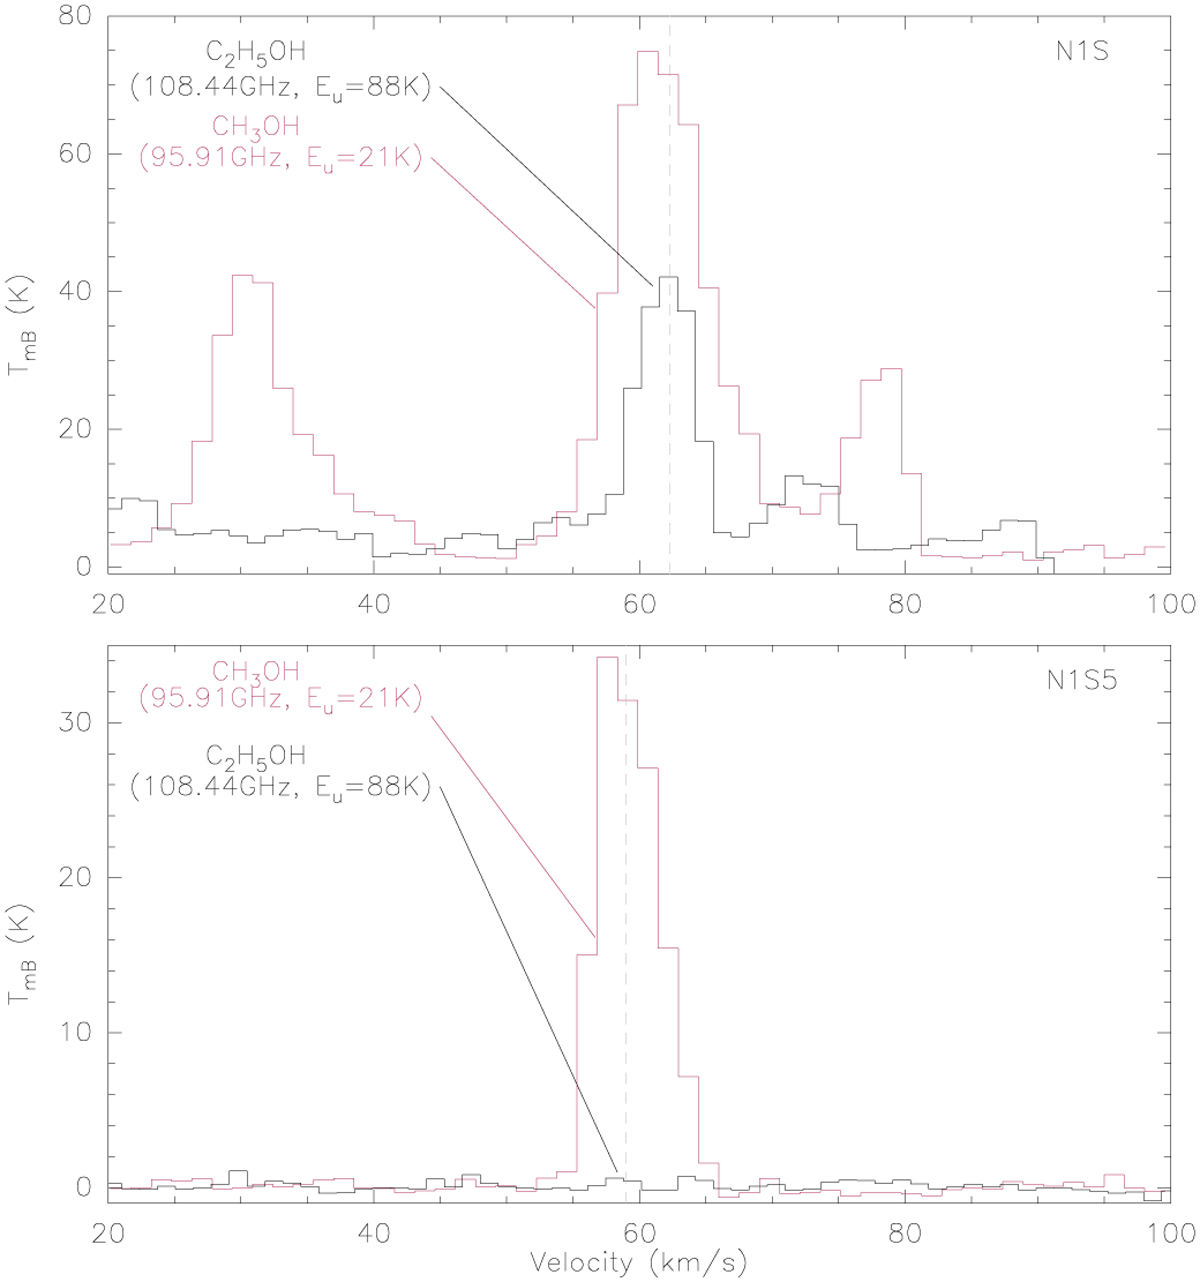
Spectra at positions N1S and N1S5 of the transitions of C2H5OH (black) and CH3OH (maroon) that were used to create maps of peak velocity and line width, which are shown in Fig. B.2. The rest frequency and upper level energy of the transition are indicated with the respective molecule and in the respective colour in the upper left corner. The grey dashed line indicates the peak velocities (62.3 km s−1 at N1S and 59 km s−1 at N1S5).
Current usage metrics show cumulative count of Article Views (full-text article views including HTML views, PDF and ePub downloads, according to the available data) and Abstracts Views on Vision4Press platform.
Data correspond to usage on the plateform after 2015. The current usage metrics is available 48-96 hours after online publication and is updated daily on week days.
Initial download of the metrics may take a while.