Fig. 16
Download original image
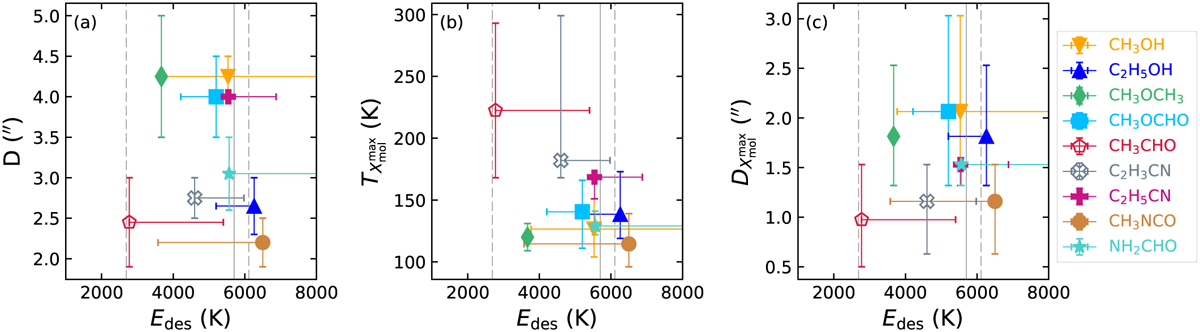
Various observed properties of the COMs as a function of binding (or desorption) energy Edes. The binding energies are taken from the third column of Table 4, with uncertainties indicating the range of values listed in that table. Panel a: Edes versus the maximum distance to which the respective COM is still detected, where distances are taken from Fig. 7. They represent the mean value from both directions for each COM, respectively. The error bars show the spread in the values. Panel b: Edes versus the rotation temperature at which the COM abundance relative to H2 peaks. The values are taken from Fig. 12. They represent the median value from both directions and both methods of H2 column density derivation for each COM, respectively. The error bars show the spread in the values. Panel c: Edes versus distance at which the abundance of a COM peaks, where distances are taken from Figs. 10 and 11. In all panels the solid grey line indicates a binding energy of water of 5700 K while the dashed lines show the possible range of values based on other studies (see Table 4). Unfilled symbols indicate species that are mainly formed in the gas phase according to the model by Garrod et al. (2022).
Current usage metrics show cumulative count of Article Views (full-text article views including HTML views, PDF and ePub downloads, according to the available data) and Abstracts Views on Vision4Press platform.
Data correspond to usage on the plateform after 2015. The current usage metrics is available 48-96 hours after online publication and is updated daily on week days.
Initial download of the metrics may take a while.