Fig. 15
Download original image
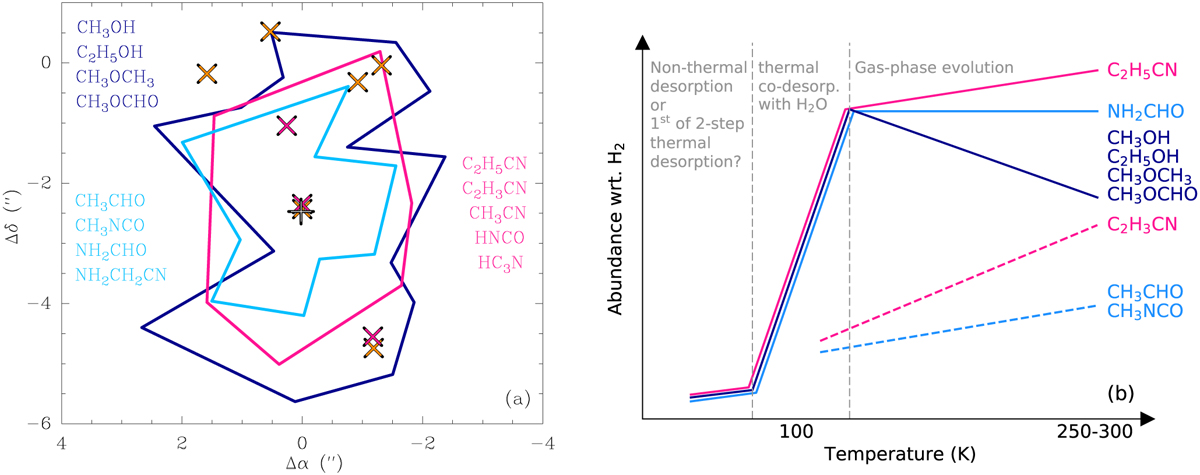
Panel a: Overview sketch of the three different types of morphology observed in the integrated intensity maps of molecular emission built with the LVINE method as shown in Fig. 4. The molecules, COMs and simpler ones, that show the respective morphology are listed in the colour of the contour. The markers are the same as in Fig. 1. Panel b: Overview sketch of the different types of abundance profile as a function of temperature (taken from Fig. 12) and their interpretation in terms of desorption process and gas-phase evolution (see Sect. 4.4). The colours are the same as in a and indicate the observed emission morphology for the respective COM. Solid and dashed lines of one colour indicate a similar morphology but different types of abundance profile.
Current usage metrics show cumulative count of Article Views (full-text article views including HTML views, PDF and ePub downloads, according to the available data) and Abstracts Views on Vision4Press platform.
Data correspond to usage on the plateform after 2015. The current usage metrics is available 48-96 hours after online publication and is updated daily on week days.
Initial download of the metrics may take a while.