Fig. 14
Download original image
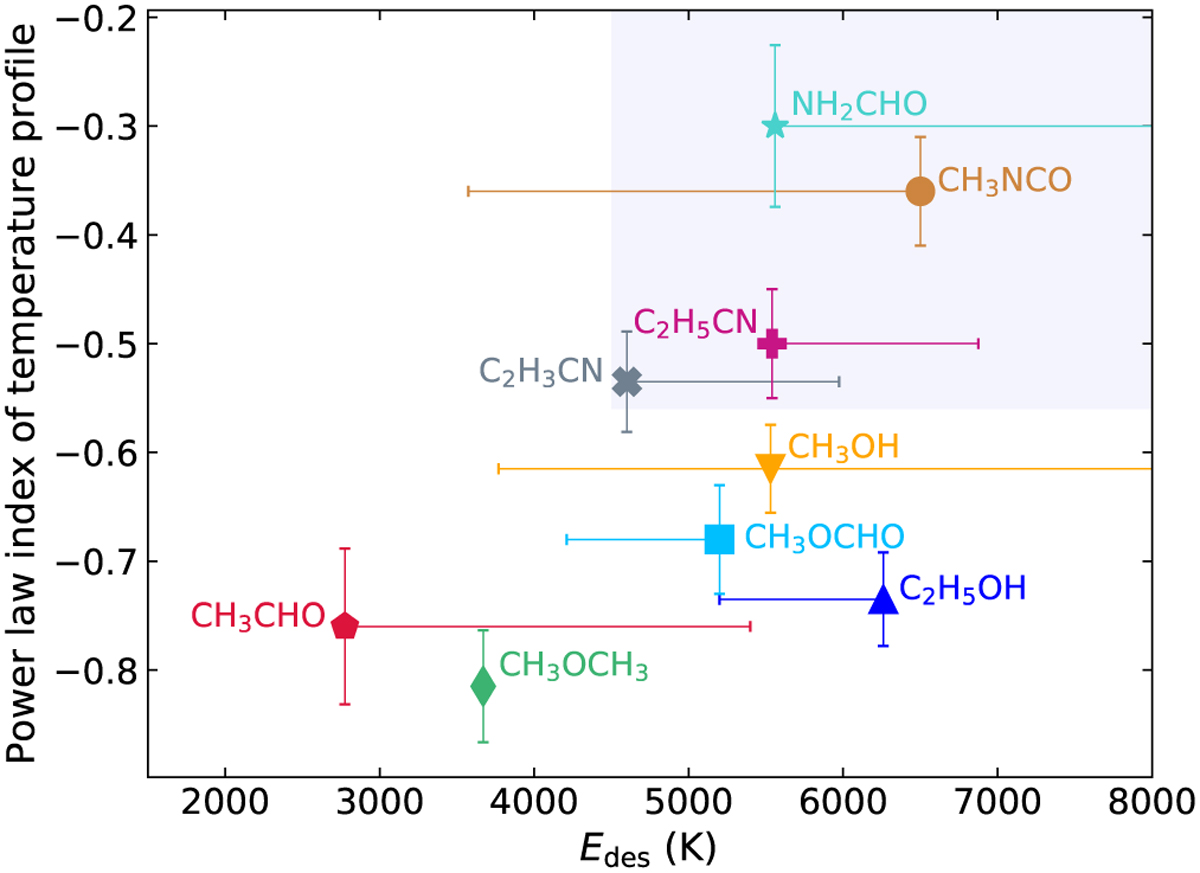
Binding (or desorption) energies versus the power-law indices of the COM temperature profiles shown in Fig. 6 averaged over the south and west directions. The binding energies are taken from the third column of Table 4, with uncertainties indicating the range of values listed in that table. The lilac rectangle highlights the location of the N-bearing COMs.
Current usage metrics show cumulative count of Article Views (full-text article views including HTML views, PDF and ePub downloads, according to the available data) and Abstracts Views on Vision4Press platform.
Data correspond to usage on the plateform after 2015. The current usage metrics is available 48-96 hours after online publication and is updated daily on week days.
Initial download of the metrics may take a while.