Fig. 13
Download original image
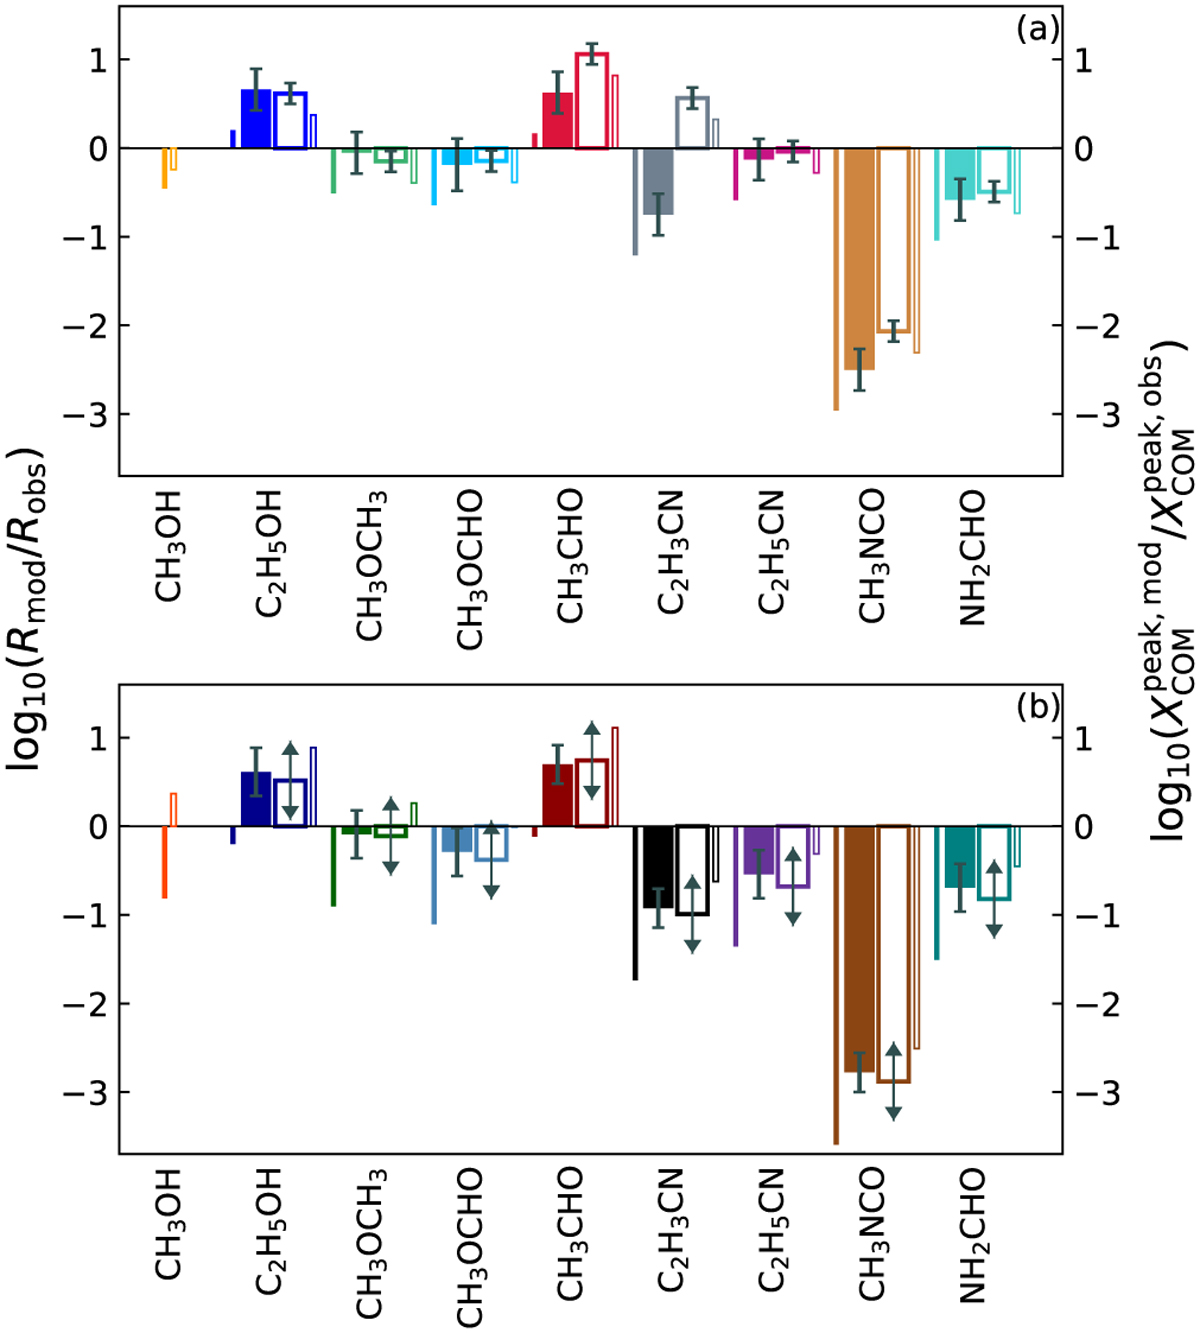
Comparison between observed peak abundances with respect to H2 and the modelled ones to the a) south and b) west, where H2 column densities were derived from dust (thick filled bars) or C18O emission (thick unfilled bars). The peaks are taken from the profiles shown in Fig. 12 and are normalised by the value for CH3OH to obtain Robs. The position of the peak can differ between the COM and methanol in all four cases. The peaks with respect to CH3OH in the models, Rmod, are taken from Table 17 in Garrod et al. (2022), where we use the values of the slow warm-up model. Thin bars show the ratio of modelled abundance peaks ![]() and observed ones
and observed ones ![]() Observed abundances are with respect to H2 derived from dust (filled bars) or C18O 1–0 emission (blank bars). Modelled peak abundances are taken from Table 16 in Garrod et al. (2022) and multiplied by a factor 2 to roughly convert to abundances with respect to H2 (from total H). All values are summarised in Table 3. Arrows pointing downwards or upwards indicate upper or lower limits, respectively.
Observed abundances are with respect to H2 derived from dust (filled bars) or C18O 1–0 emission (blank bars). Modelled peak abundances are taken from Table 16 in Garrod et al. (2022) and multiplied by a factor 2 to roughly convert to abundances with respect to H2 (from total H). All values are summarised in Table 3. Arrows pointing downwards or upwards indicate upper or lower limits, respectively.
Current usage metrics show cumulative count of Article Views (full-text article views including HTML views, PDF and ePub downloads, according to the available data) and Abstracts Views on Vision4Press platform.
Data correspond to usage on the plateform after 2015. The current usage metrics is available 48-96 hours after online publication and is updated daily on week days.
Initial download of the metrics may take a while.