Fig. 12
Download original image
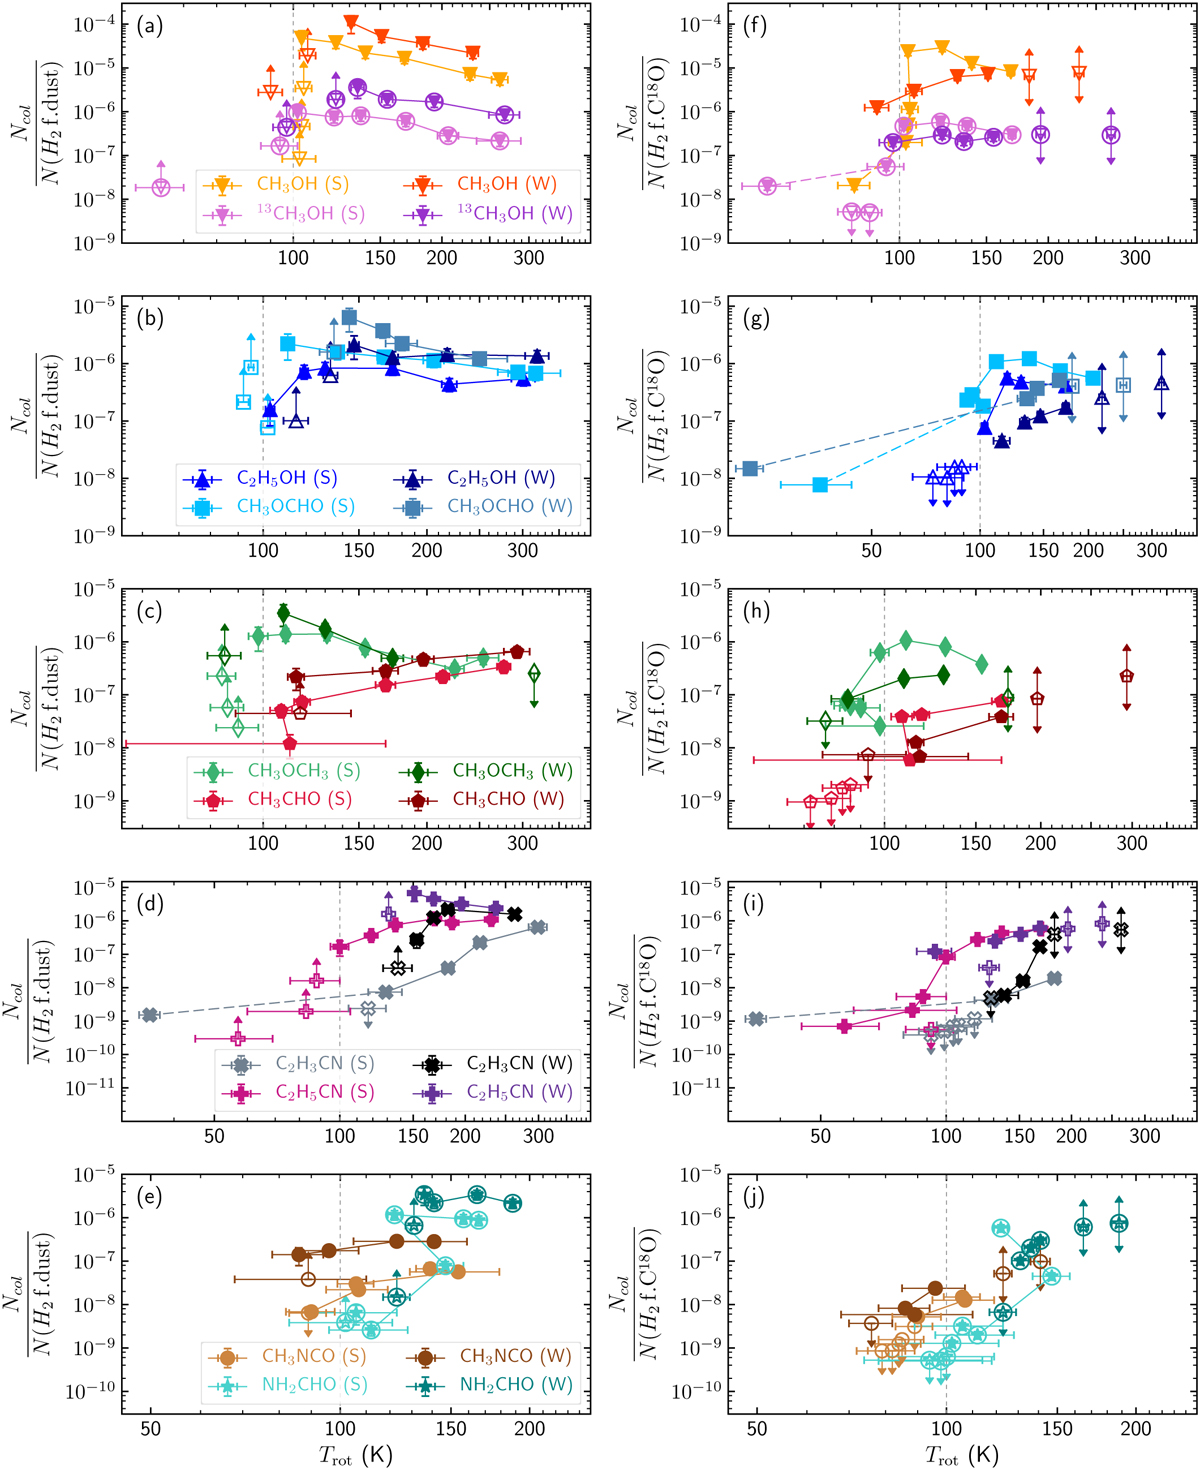
COM abundance profiles with respect to H2 to the south (S) and west (W) as a function of rotational temperature taken from Fig. 6. H2 column densities were derived from either dust emission (f. dust, a–e) or C18O 1–0 emission (f. C18O, f–j). Coloured dashed lines indicate the connection to points for which the temperature was either fixed in the population diagram, where a value was obtained from extrapolating the respective temperature profile, or derived from the population diagram but not considered in the fit to the temperature profiles shown in Fig. 6. Unfilled symbols with arrows pointing downwards or upwards indicate upper or lower limits, respectively. Encircled symbols indicate the species for which data from observational setups 1–3 were used, instead of 4–5.
Current usage metrics show cumulative count of Article Views (full-text article views including HTML views, PDF and ePub downloads, according to the available data) and Abstracts Views on Vision4Press platform.
Data correspond to usage on the plateform after 2015. The current usage metrics is available 48-96 hours after online publication and is updated daily on week days.
Initial download of the metrics may take a while.