Fig. 11
Download original image
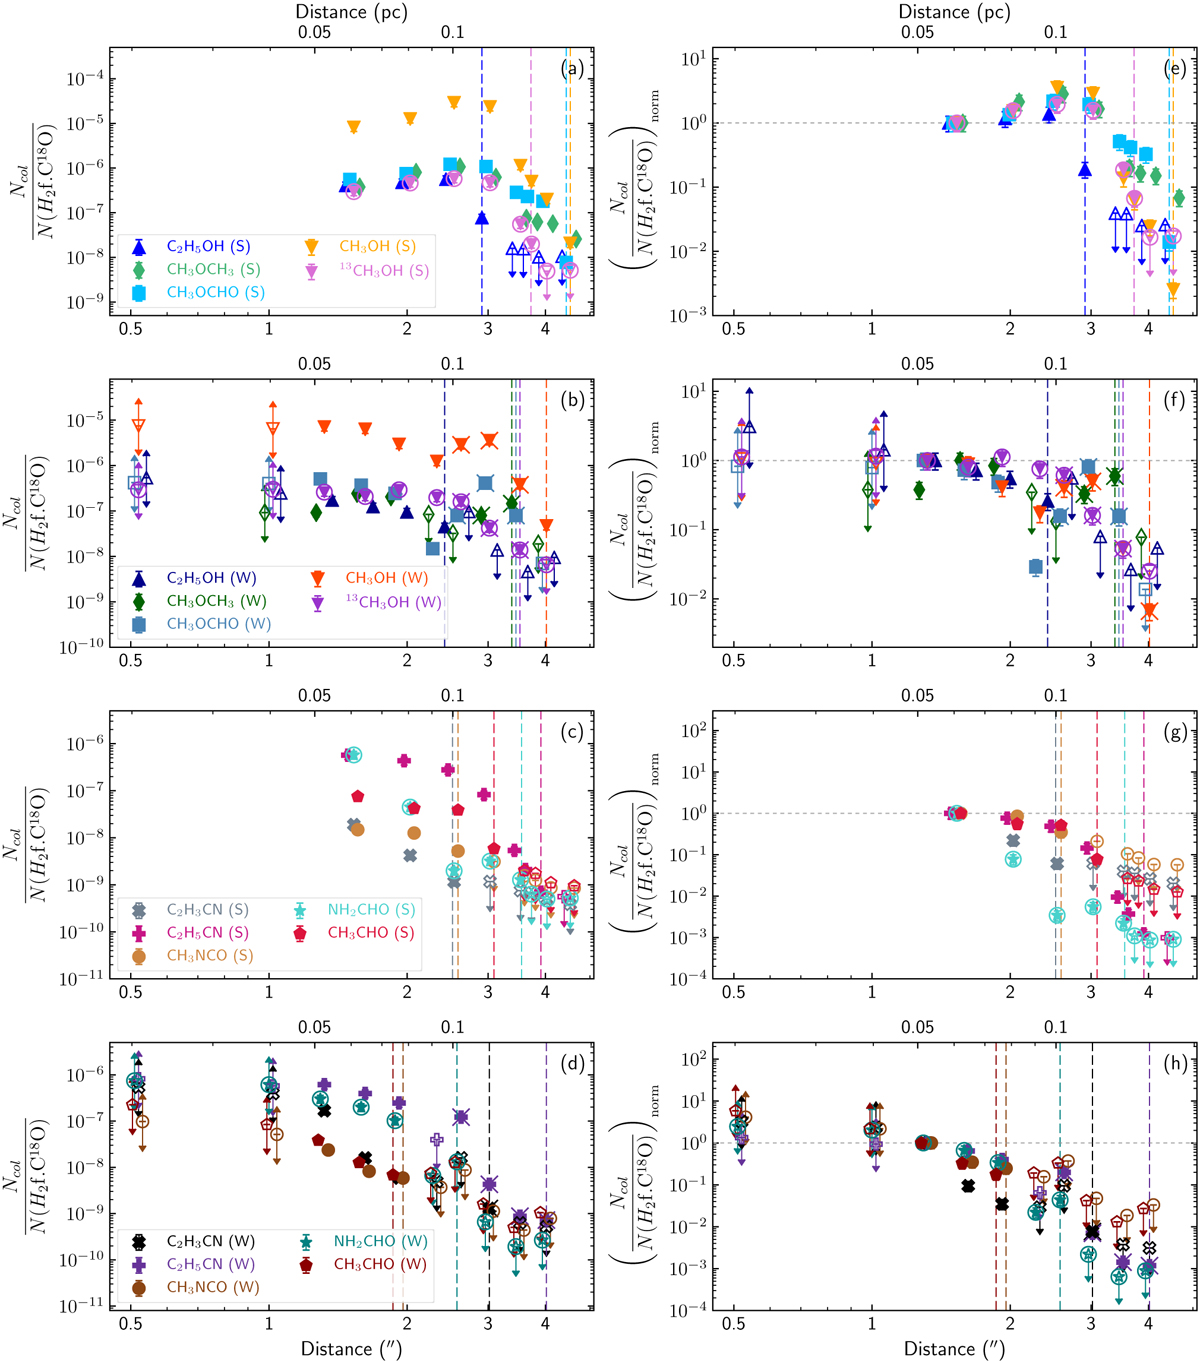
COM abundance profiles with respect to H2 (f. C18O = derived from C18O 1–0 emission) to the south (S) and to the west (W) based on data from observational setups 1–3 (encircled symbols) and 4–5. Panels a–d: original COM abundances. Panels e–h: abundances normalised to the value at 1.5″ distance to Sgr B2 (N1). Unfilled symbols with arrows pointing downwards or upwards indicate upper or lower limits, respectively. Vertical dashed lines mark the distance from Sgr B2 (N1) beyond which the respective COM is no longer detected.
Current usage metrics show cumulative count of Article Views (full-text article views including HTML views, PDF and ePub downloads, according to the available data) and Abstracts Views on Vision4Press platform.
Data correspond to usage on the plateform after 2015. The current usage metrics is available 48-96 hours after online publication and is updated daily on week days.
Initial download of the metrics may take a while.