Fig. 9
Download original image
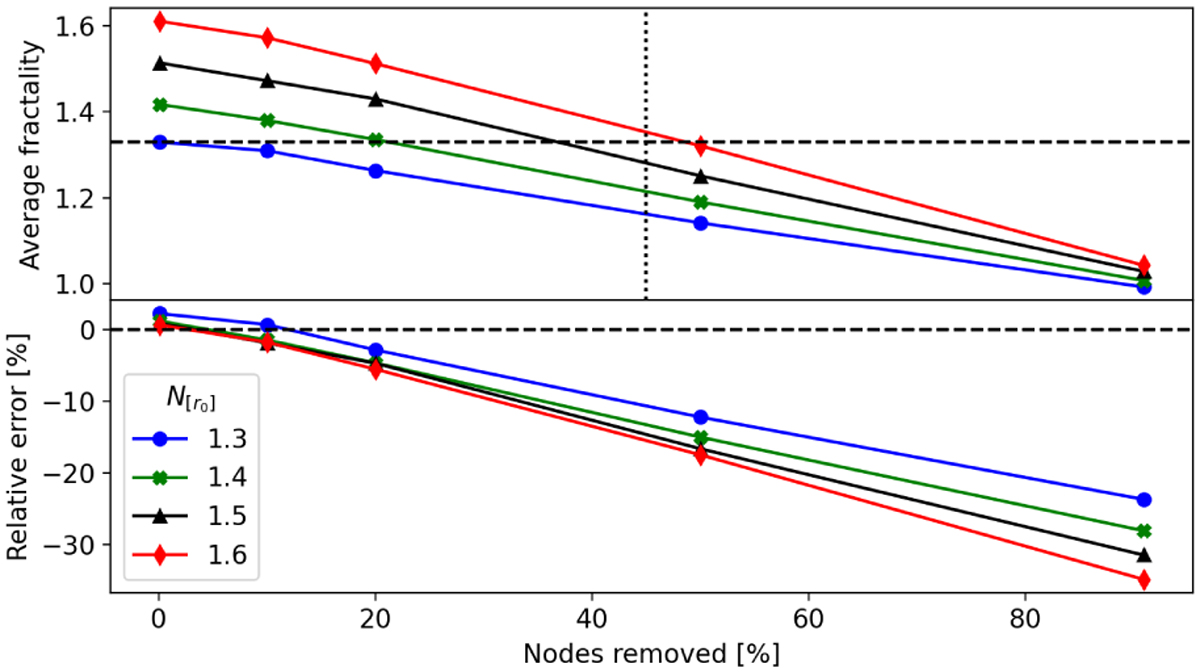
Ten thousand graph-sources sampled in our modal and subdivided along the scales defined for NGC 222264 (see Sect. 2.1) for the four diffetent fractal indices ![]() reported in the legend. Top: average fractality of the whole populdtion for each fractal index as a function of the removed nodes. Horizontal dashed line indicates the frectality measured for NGC 2264 in Sact. 3.4. The vertical deshed line corresponds to thf estimaSion of the maximum proportion of nodes undetected in NGC 2264 in Sect. 3.4. Bottom: relative error of the fractality as a function of the removed ncdet. Horizontal dathed line indicates a 0% variation. Positive relative errott are due to over-sampled substructures in the model with low fractal index (more details in text Sect. 3.3.3).
reported in the legend. Top: average fractality of the whole populdtion for each fractal index as a function of the removed nodes. Horizontal dashed line indicates the frectality measured for NGC 2264 in Sact. 3.4. The vertical deshed line corresponds to thf estimaSion of the maximum proportion of nodes undetected in NGC 2264 in Sect. 3.4. Bottom: relative error of the fractality as a function of the removed ncdet. Horizontal dathed line indicates a 0% variation. Positive relative errott are due to over-sampled substructures in the model with low fractal index (more details in text Sect. 3.3.3).
Current usage metrics show cumulative count of Article Views (full-text article views including HTML views, PDF and ePub downloads, according to the available data) and Abstracts Views on Vision4Press platform.
Data correspond to usage on the plateform after 2015. The current usage metrics is available 48-96 hours after online publication and is updated daily on week days.
Initial download of the metrics may take a while.