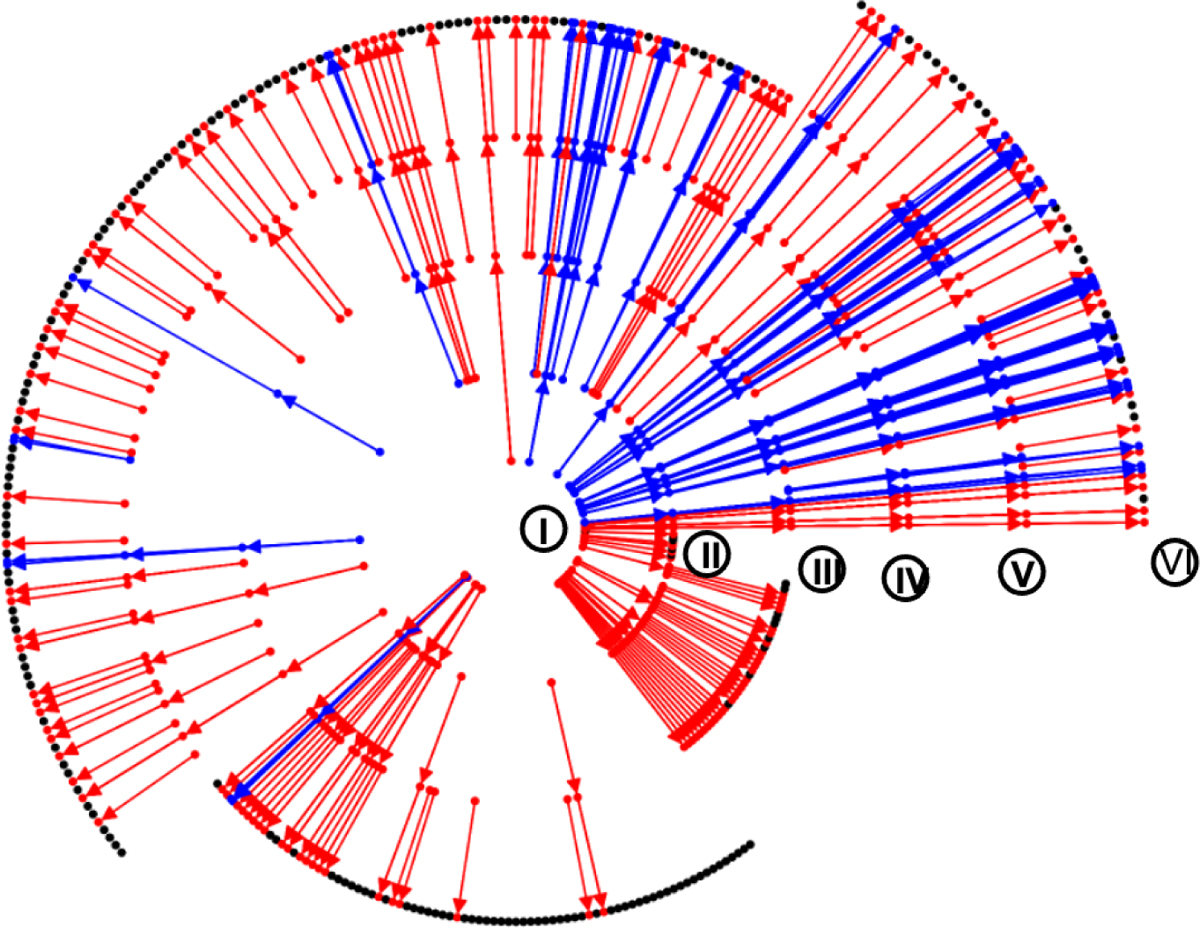
Fig. 3

Download original image
Network representation of the data. Each substructure is represented as a node with respect to its specific scale, associated with a ring. Rings from I to VI represent respectively [26, 18, 13, 10, 6] kAU and class 0/I YSOs at 1.4 kAU such that inner rings represent the larger substructures and the scale is decreasing towards the outer rings. The angular position indicates the membership of substructures to a structure. The cascade of one structure is processed in the same direction towards the exterior of the wheel. Blue, red, and black colours represent hierarchical, linear, and isolated structures, respectively.
Current usage metrics show cumulative count of Article Views (full-text article views including HTML views, PDF and ePub downloads, according to the available data) and Abstracts Views on Vision4Press platform.
Data correspond to usage on the plateform after 2015. The current usage metrics is available 48-96 hours after online publication and is updated daily on week days.
Initial download of the metrics may take a while.


