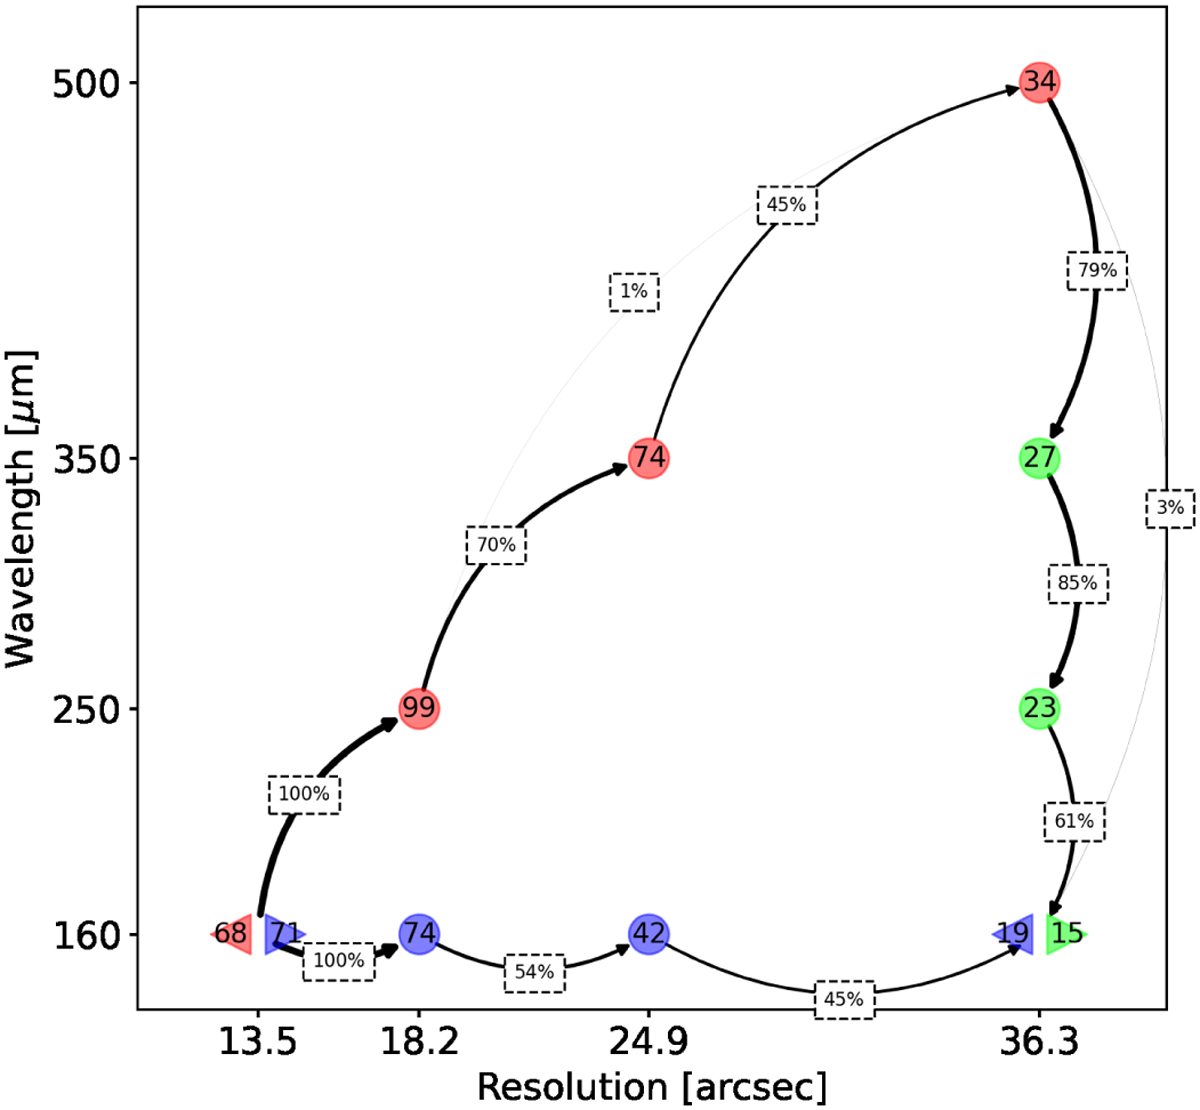
Fig. 12
Download original image
Representation of the successive association of clumps between scales and wavelengths for linear structures. Red markers are associated with the original data from NGC 2264. Blue markers are associated with the data from the convolution of the image at 160 μm to resolutions of 13.5, 24.9, and 36.3″. Green markers are associated with data from the convolution of the 160, 250, and 350 μm maps to a resolution of 36.3″. The numbers in the markers indicate the number of associated substructures. Triangle markers are turning points to make it clear that even though the data are the same, the substructures associated with the linear structures may change. The percentage in the middle of the arrows gives the proportion of substructures that persist from the out-coming node to the in-coming node.
Current usage metrics show cumulative count of Article Views (full-text article views including HTML views, PDF and ePub downloads, according to the available data) and Abstracts Views on Vision4Press platform.
Data correspond to usage on the plateform after 2015. The current usage metrics is available 48-96 hours after online publication and is updated daily on week days.
Initial download of the metrics may take a while.