Fig. 11
Download original image
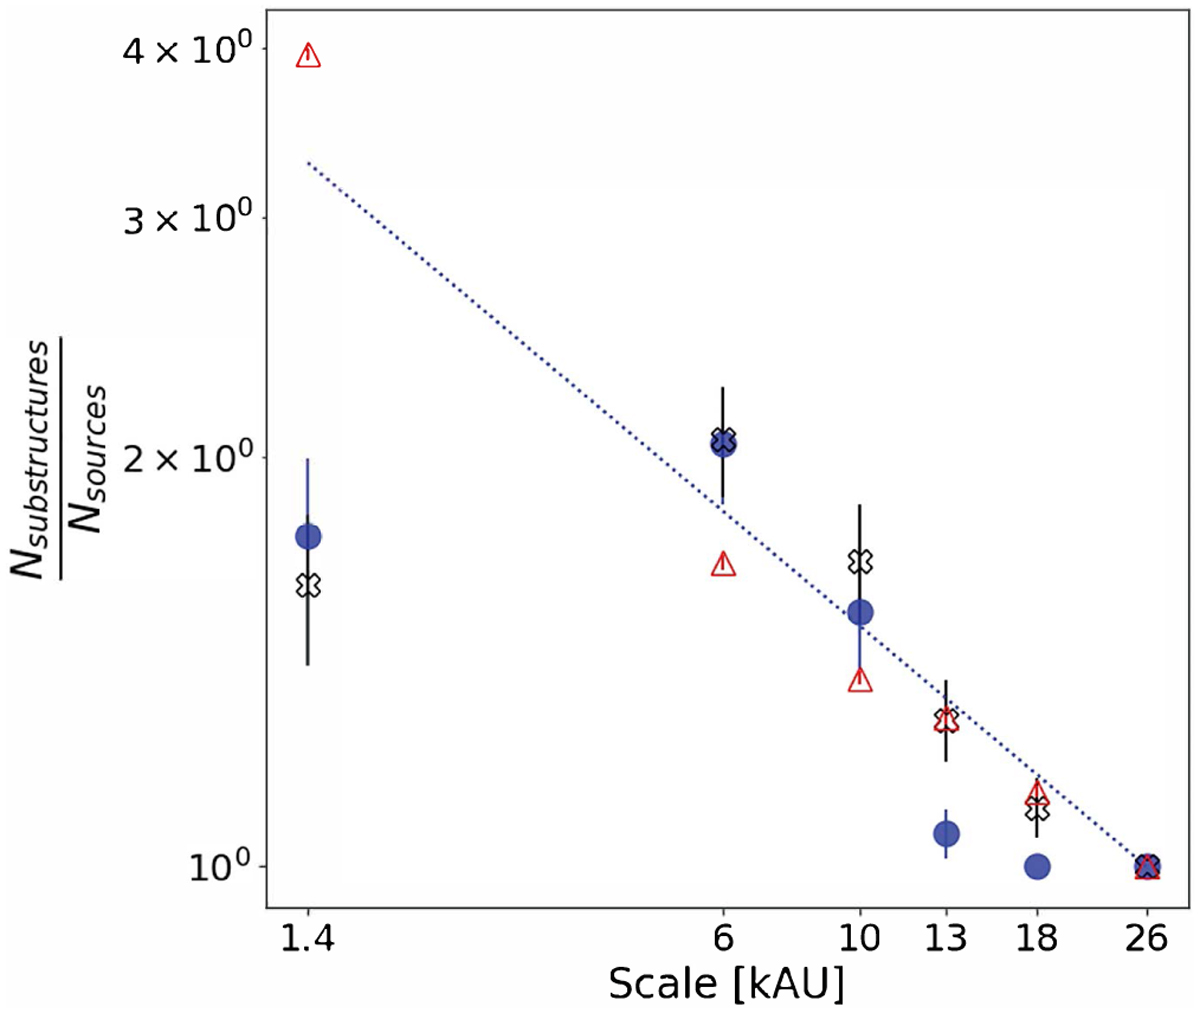
Average productivity of hierarchical structures for each scale. Blue circles represent NGC 2264 data. Red triangles represent a population of 1000 structures generated by our geometrical model with a fractal index of 1.57 where we have removed 45% of the nodes. Blue dotted curve represents an ideal fractal fragmentation of index 1.33. Black crosses represent the same curve for convolved data (see Sect. 4).
Current usage metrics show cumulative count of Article Views (full-text article views including HTML views, PDF and ePub downloads, according to the available data) and Abstracts Views on Vision4Press platform.
Data correspond to usage on the plateform after 2015. The current usage metrics is available 48-96 hours after online publication and is updated daily on week days.
Initial download of the metrics may take a while.