Open Access
Fig. 1
Download original image
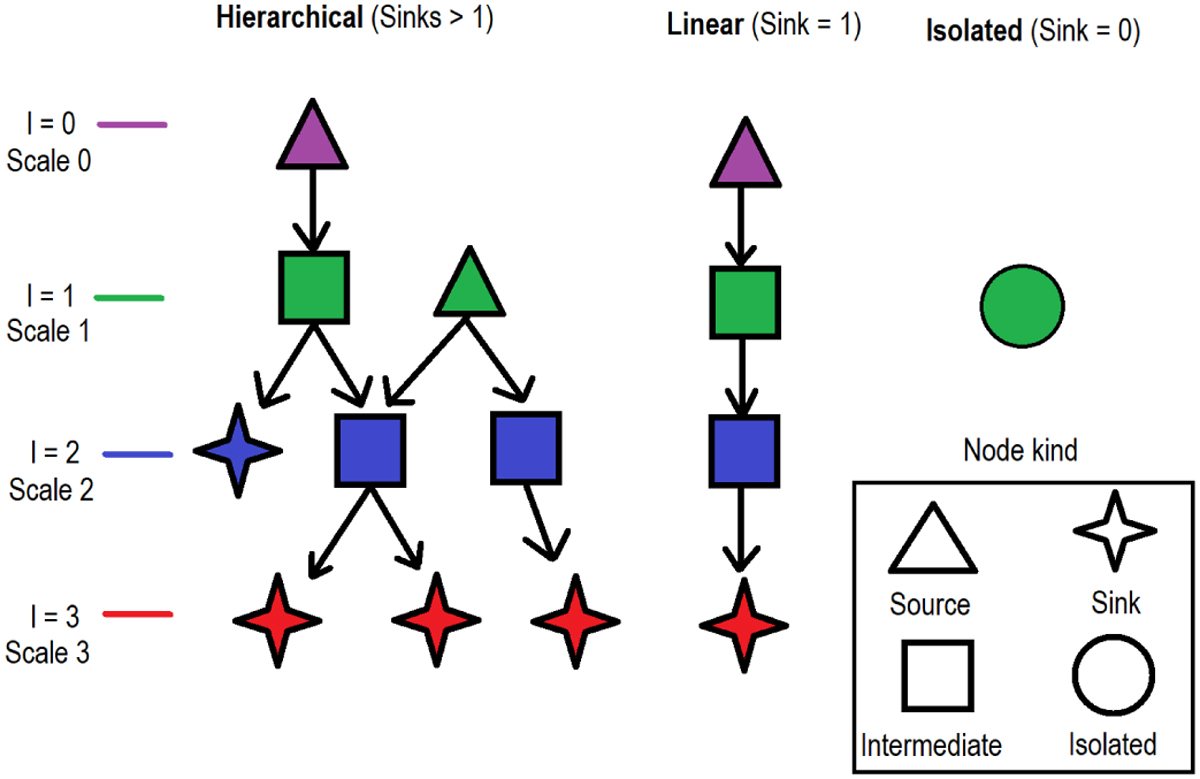
Organisation of a network and definition of nodes. Each colour corresponds to a scale. Each node shape corresponds to a specific kind (source, sink, intermediate, or isolated). Three structures are represented: hierarchical, linear, or isolated. One example of each type of structure is shown.
Current usage metrics show cumulative count of Article Views (full-text article views including HTML views, PDF and ePub downloads, according to the available data) and Abstracts Views on Vision4Press platform.
Data correspond to usage on the plateform after 2015. The current usage metrics is available 48-96 hours after online publication and is updated daily on week days.
Initial download of the metrics may take a while.