Fig. 1.
Download original image
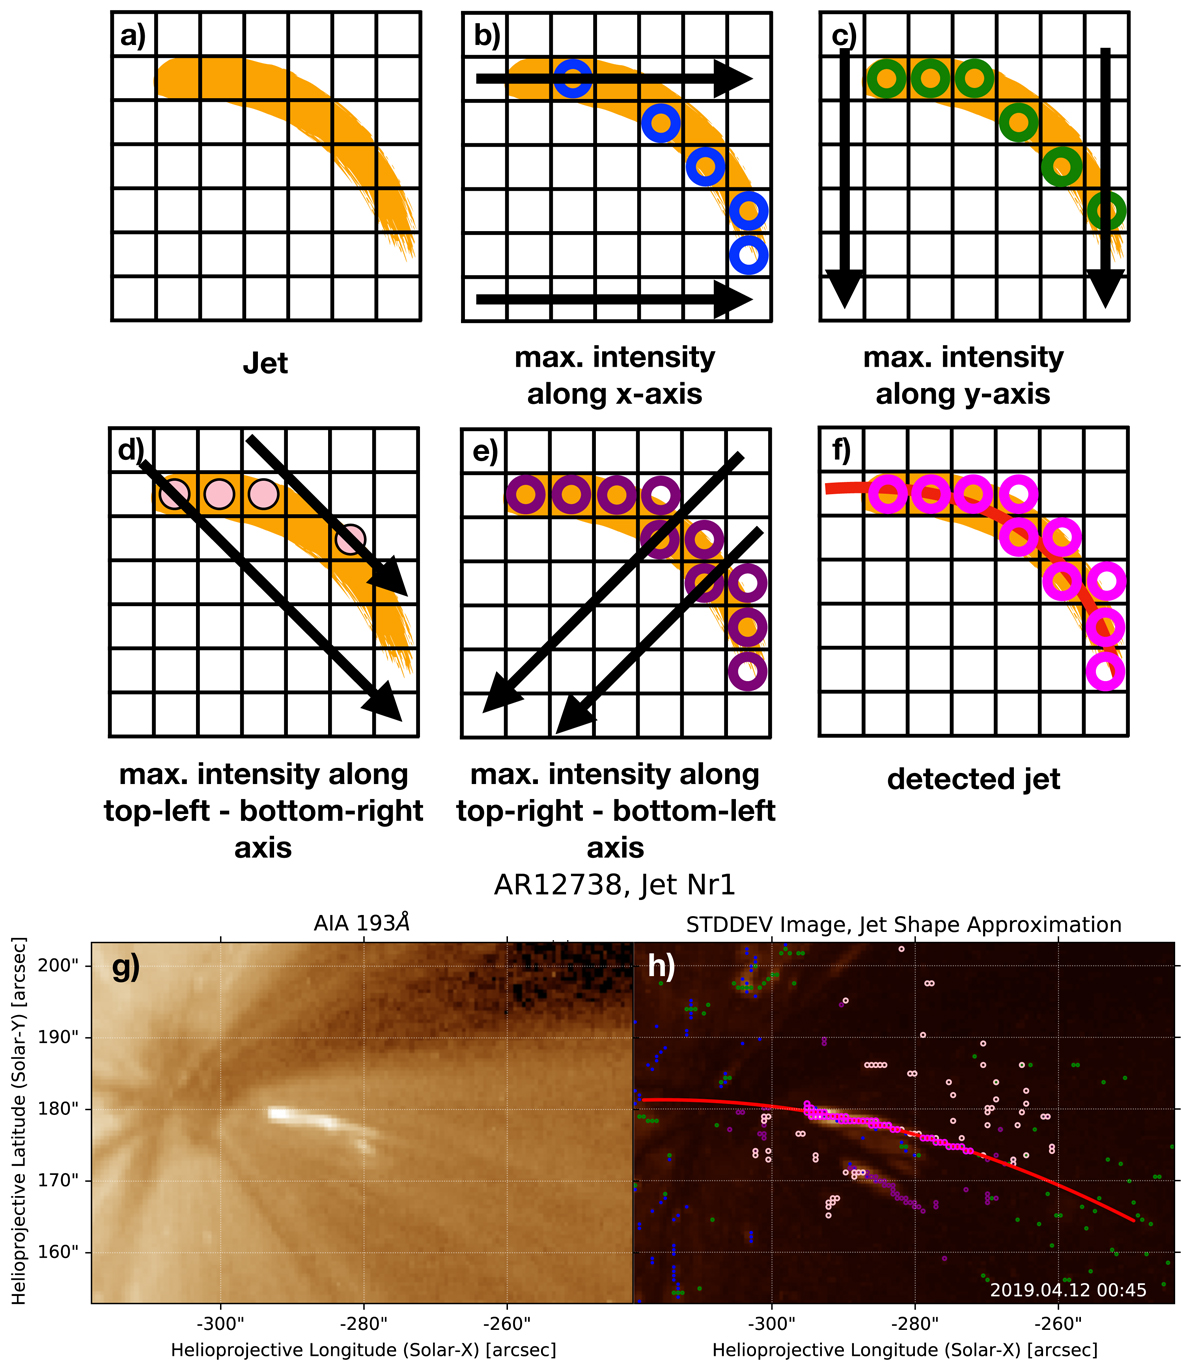
Jet shape determination method (panels a–f), an example jet observed in AIA 193 Å (panel g), and the shape determination of a jet (panel h). The six panels (a–f) present the schematic algorithm of the jet (yellow) shape determination. The pixels with maximal intensities along the X and Y axis of the jet are marked in blue (panel b) and green (panel c). The pixels with maximal intensity along the diagonal axes starting from the top right and the top left are coloured in light pink (panel d) and violet (panel e). Manual selection of points is coloured in pink (panel f). The fitted quadratic polynomial is marked as a red line connecting the pink dots (panel f). The jet shape (panel g) was determined by applying the method presented in panels a–f to a STDDEV map for a time frame of ±10 min around the presented jet time. In panel h, the colour codding is the same as in panels a–f.
Current usage metrics show cumulative count of Article Views (full-text article views including HTML views, PDF and ePub downloads, according to the available data) and Abstracts Views on Vision4Press platform.
Data correspond to usage on the plateform after 2015. The current usage metrics is available 48-96 hours after online publication and is updated daily on week days.
Initial download of the metrics may take a while.