Fig. 9.
Download original image
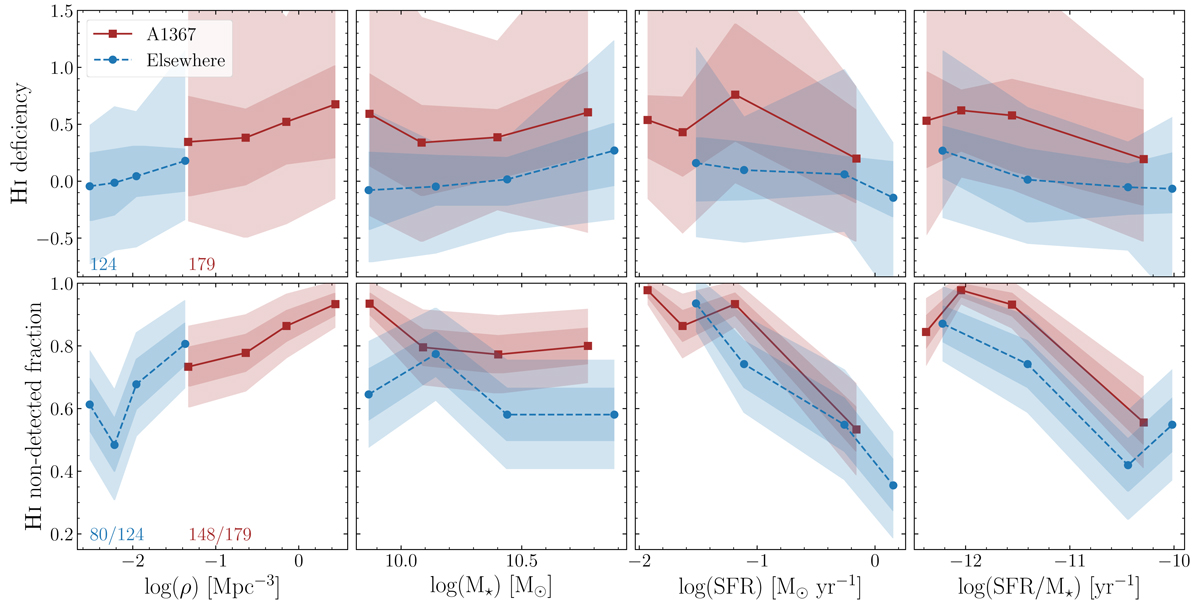
H I deficiency (top) and H I ‘non-detected fraction’ (bottom), as a function of (left to right) local galaxy density, stellar mass, star formation rate, and specific star formation rate. Cluster galaxies are shown with brown squares and solid lines, galaxies outside the cluster are shown with blue dots and dashed lines. The number of galaxies in the two environments is printed in the top left panel in the corresponding colour. The overall number of “non-detected”/all galaxies is printed in the bottom left panel. The shaded regions show 1σ and 2σ assuming normal distribution. ![]() [Link]
[Link]
Current usage metrics show cumulative count of Article Views (full-text article views including HTML views, PDF and ePub downloads, according to the available data) and Abstracts Views on Vision4Press platform.
Data correspond to usage on the plateform after 2015. The current usage metrics is available 48-96 hours after online publication and is updated daily on week days.
Initial download of the metrics may take a while.