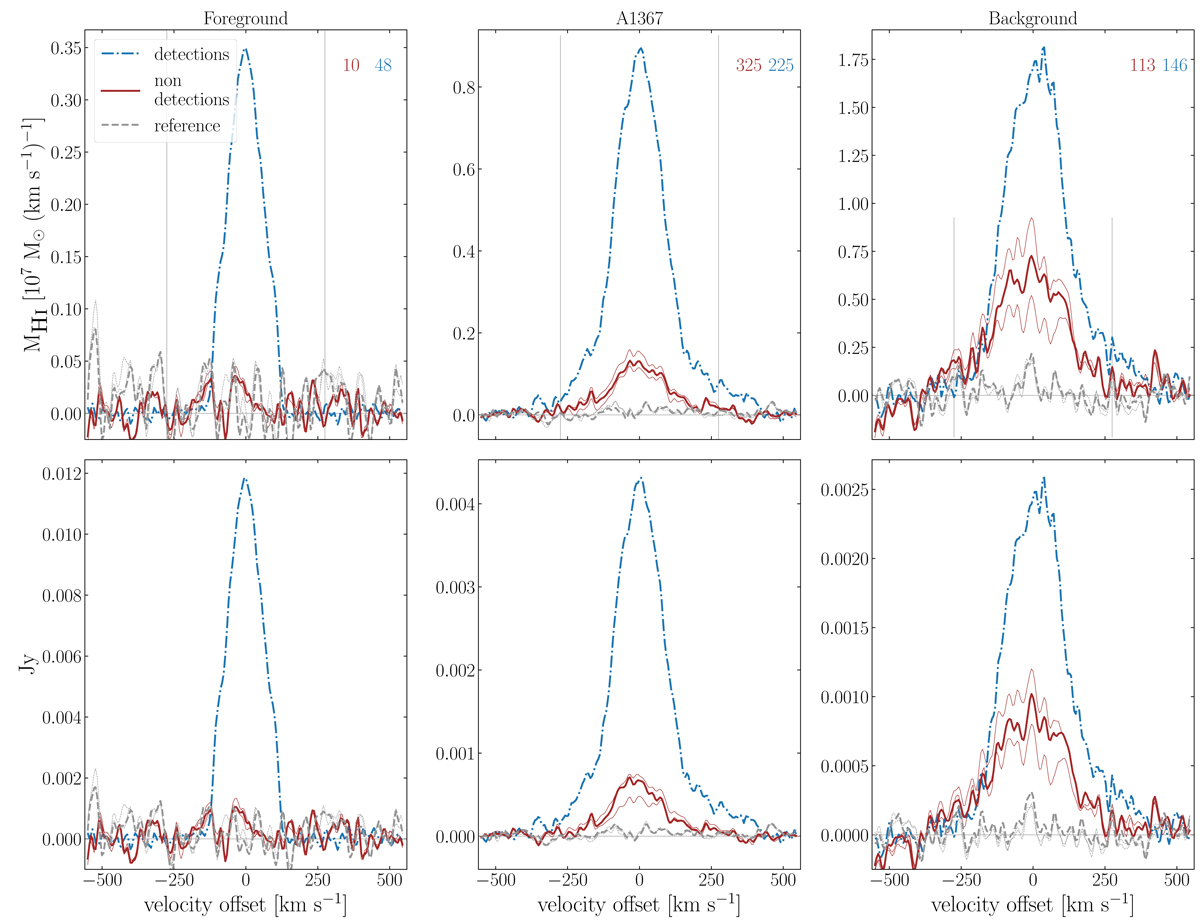
Fig. 7.
Download original image
H I signal present in the data below the detection threshold (brown curves) recovered by stacking spectra from galaxies in A1367, those infront of and behind it. The thick lines show the median and the thin ones the 95% confidence interval of the distribution of total MH I in the stacked spectra, from jackknife resampling. For comparison, the dash-dotted blue lines shows the average spectrum of all individually detected galaxies. The dashed grey curves show the signal distribution in a reference stack (see text for details). The vertical grey lines show the velocity range over which the curves are integrated. The total number of galaxies in each stack is indicated at the top, coloured in blue for detections and red for non-detections. The bottom row shows the same spectra but in flux units. ![]() [Link]
[Link]
Current usage metrics show cumulative count of Article Views (full-text article views including HTML views, PDF and ePub downloads, according to the available data) and Abstracts Views on Vision4Press platform.
Data correspond to usage on the plateform after 2015. The current usage metrics is available 48-96 hours after online publication and is updated daily on week days.
Initial download of the metrics may take a while.